MapBusinessOnline Pro – A Solution for Where & When Challenges Related to Location

What problems does MapBusinessOnline Pro solve for the average customer using the tool?

Business mapping software and GIS are geographic software solutions that address business challenges from a location perspective. In other words, a subscribing user of MapBusinessOnline would use the software to address a business problem within their industry that is related to location in some way.

Finance Business Problems

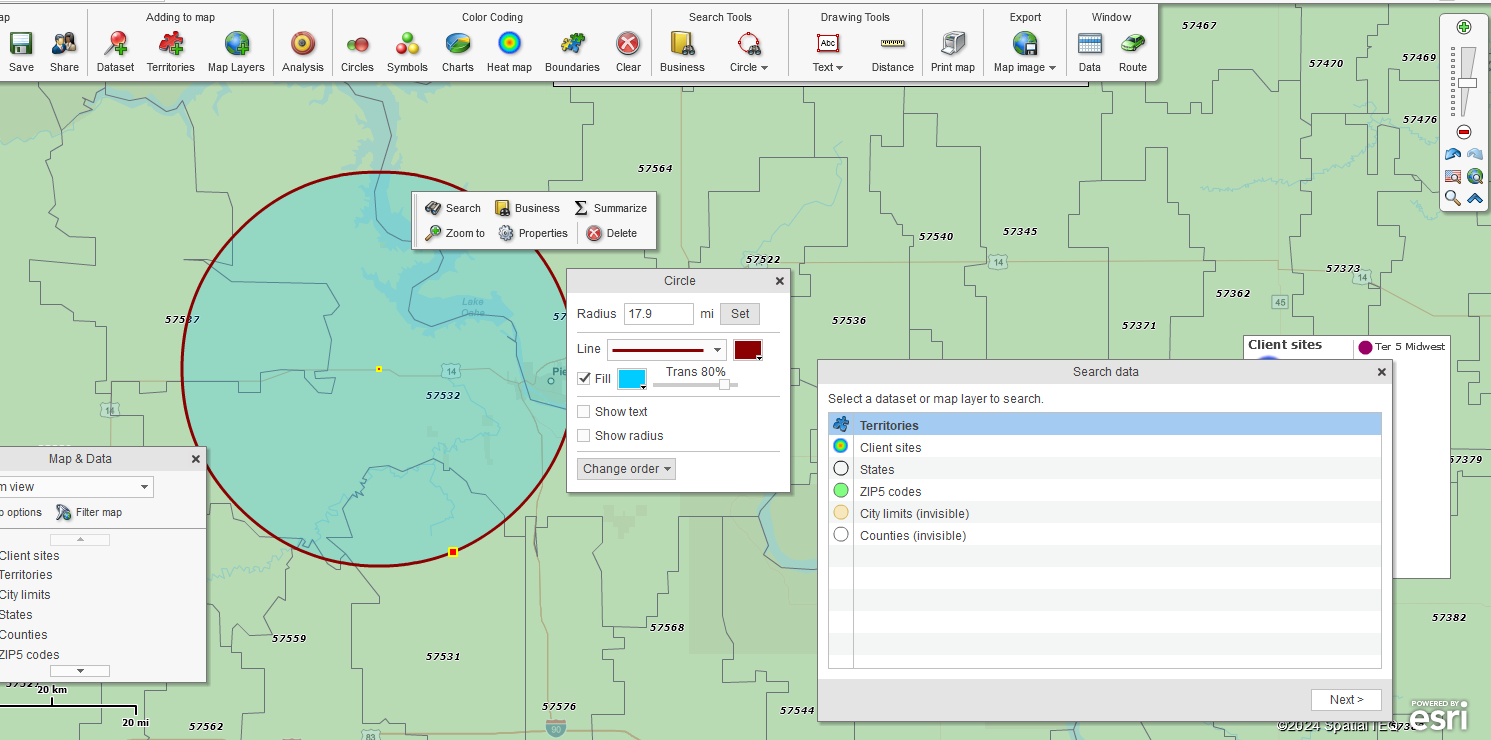
For example, a banker might examine the problem of monitoring real estate investment risks for a specific business client. Instead of viewing those investments by account number in a spreadsheet, they might also use MapBusinessOnline to create a location-based Map Visualization of those investments overlaid on a ZIP code or group of ZIP codes or perhaps over a radius search of 10 miles from a given center point.

Once defined on a MapBusinessOnline business map, a specific area of interest can be easily overlaid with an array of relevant location data. For risk assessment in the above banking example, the area of interest can be enhanced with demographic information, imported business, and other relevant datasets.

What problems does MapBusinessOnline solve for a banking business?

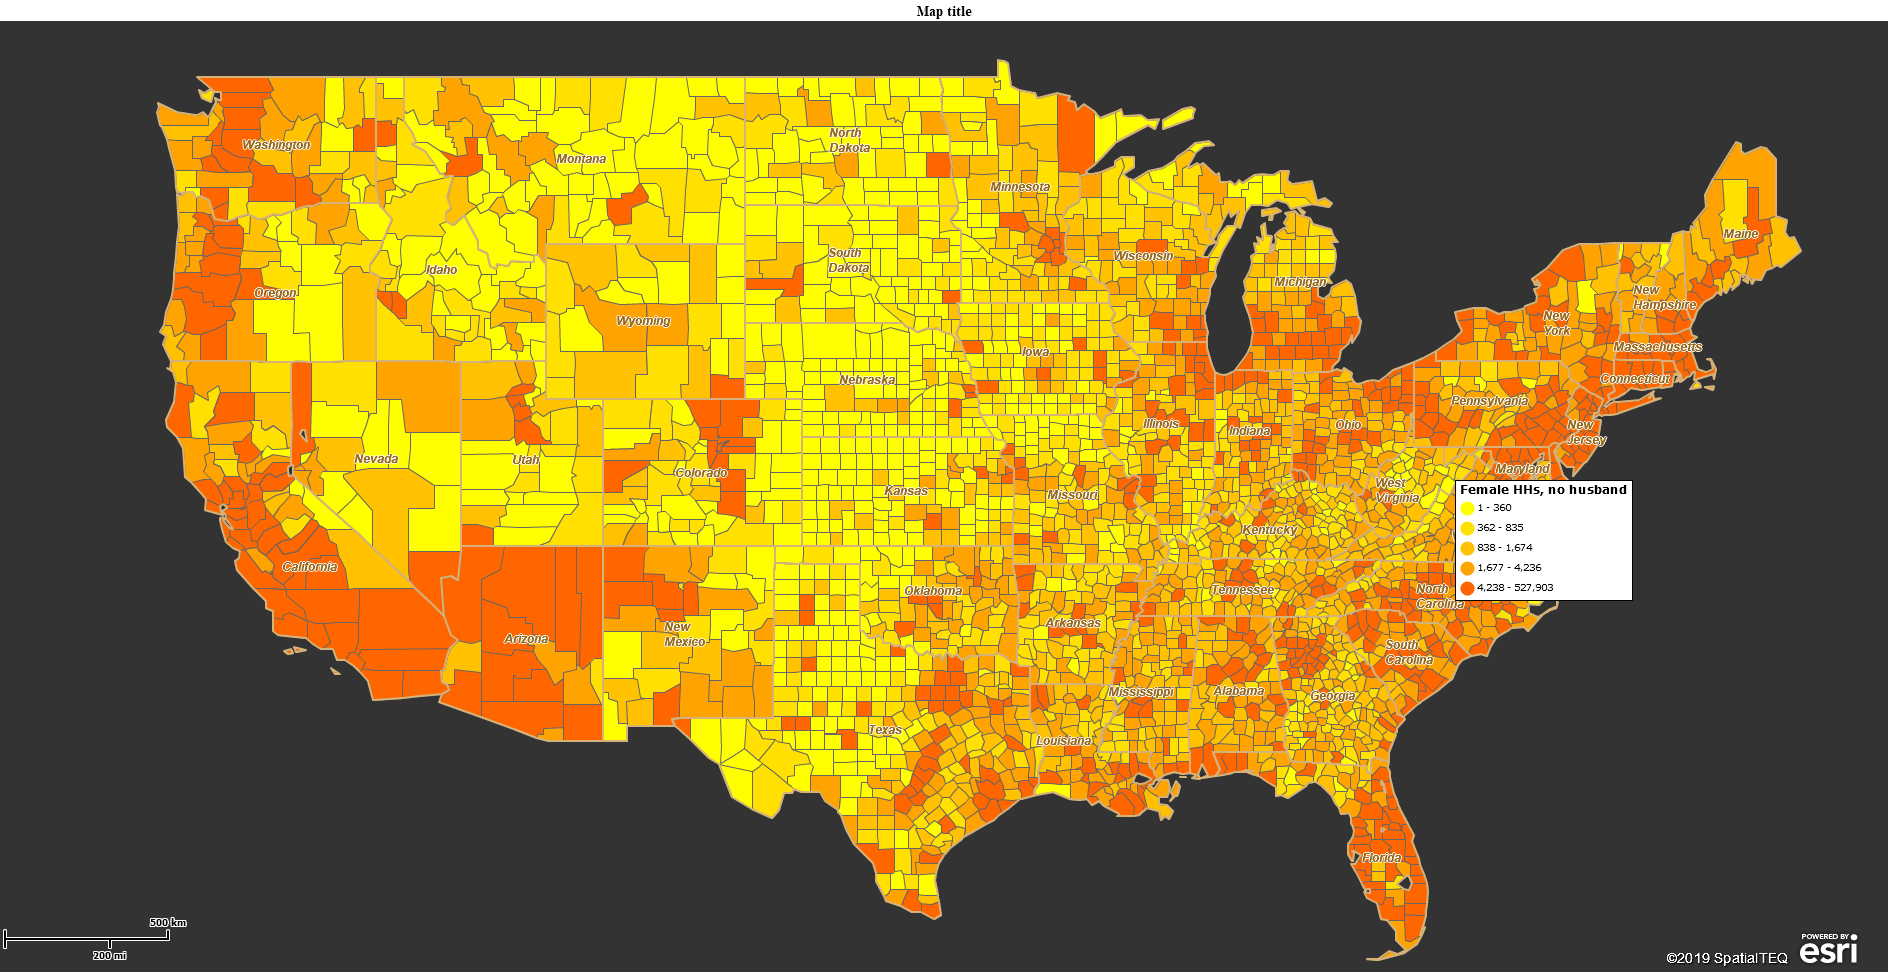
  1. Exposing possible mortgage and loan area risks. Map visualizations can display color-coded ZIP codes that reflect high-risk neighborhoods based on loan portfolios and demographic trends.
  2. Business maps that include actual client home and business locations with relevant financial data can be symbolized to reflect investment or payment histories—banks like knowing where both good and bad customers spend their money.
ZIP Codes Med Household Income Population No. of Snow Tires Sold Winter 2024 Mortgage Values
27415 $57,875 5478 216 $12 million
27418 $63,978 4879 187 $8 million
27419 $61,879 6014 235 $6 million

An example of business data that could be imported into MapBusinessOnline.

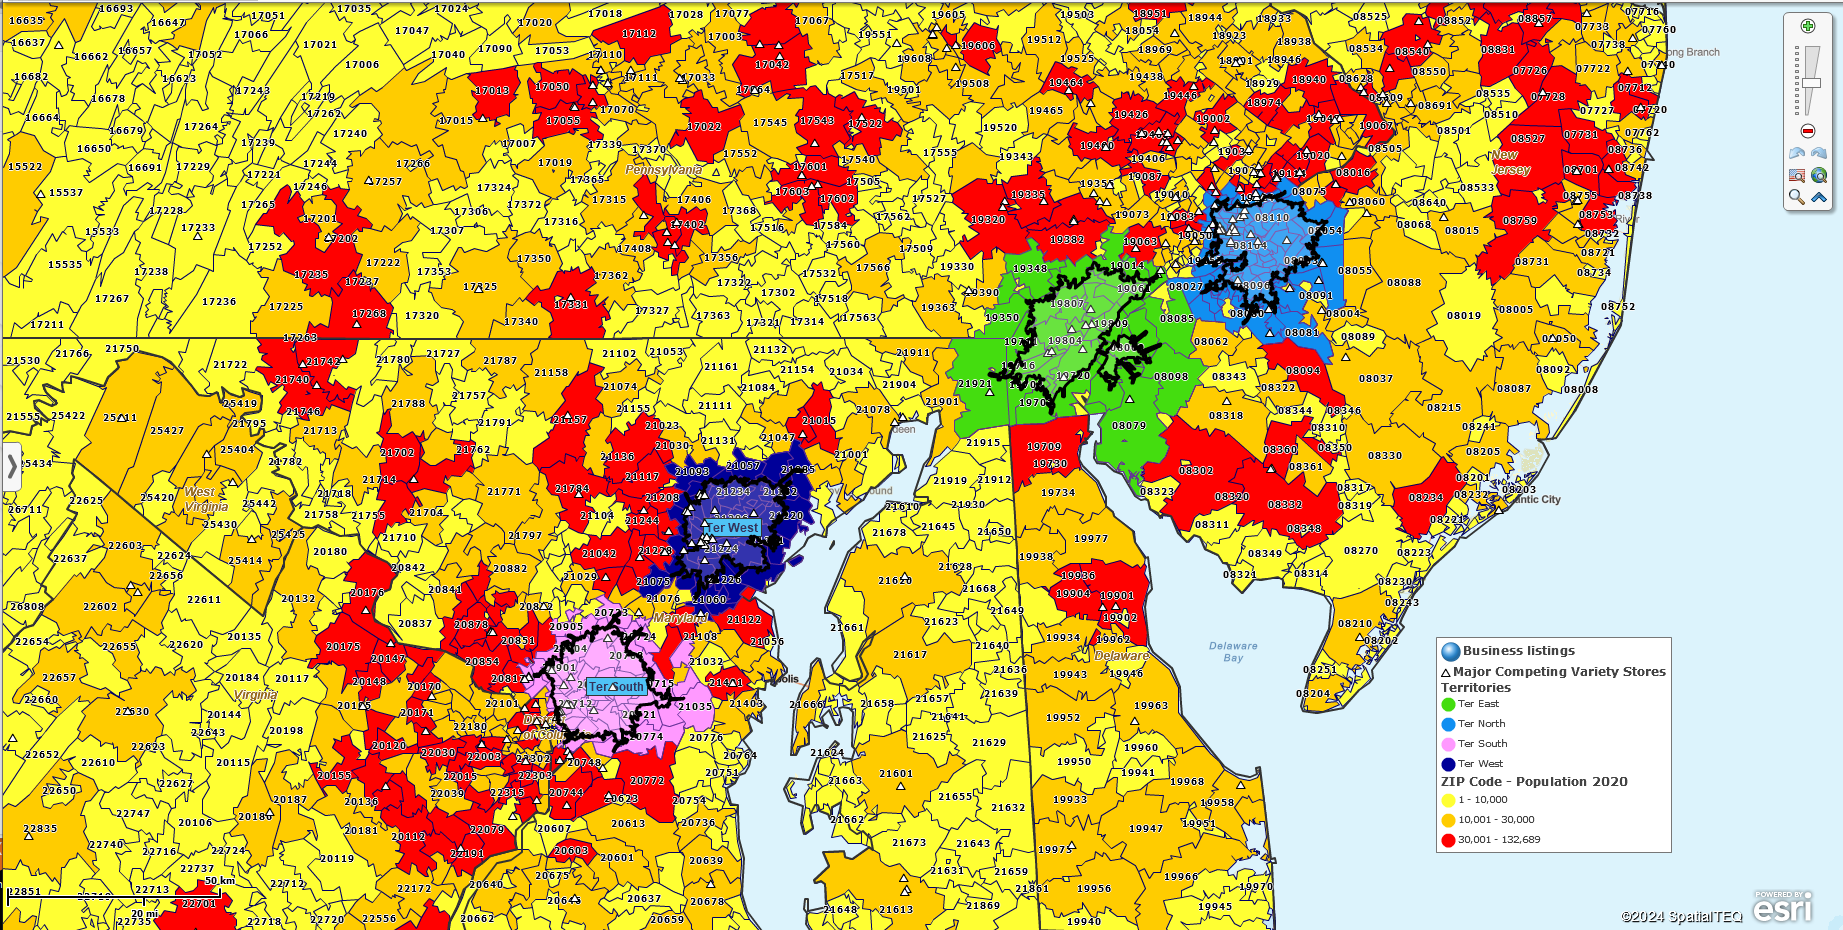
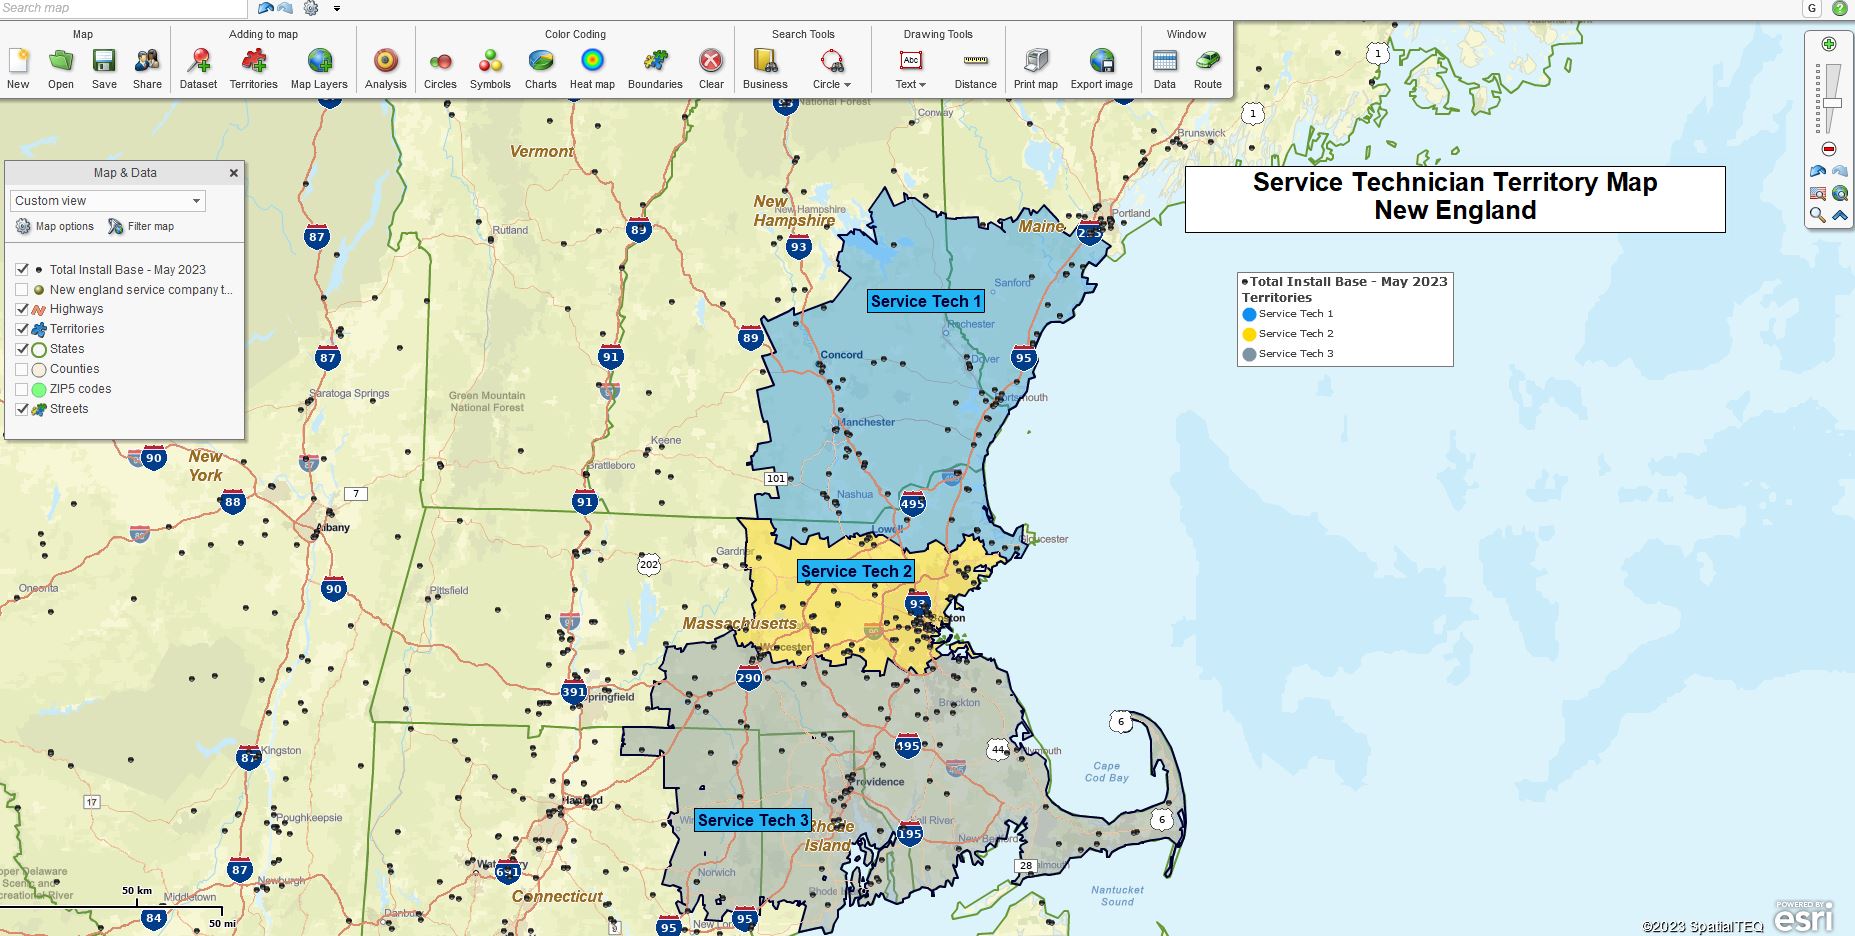
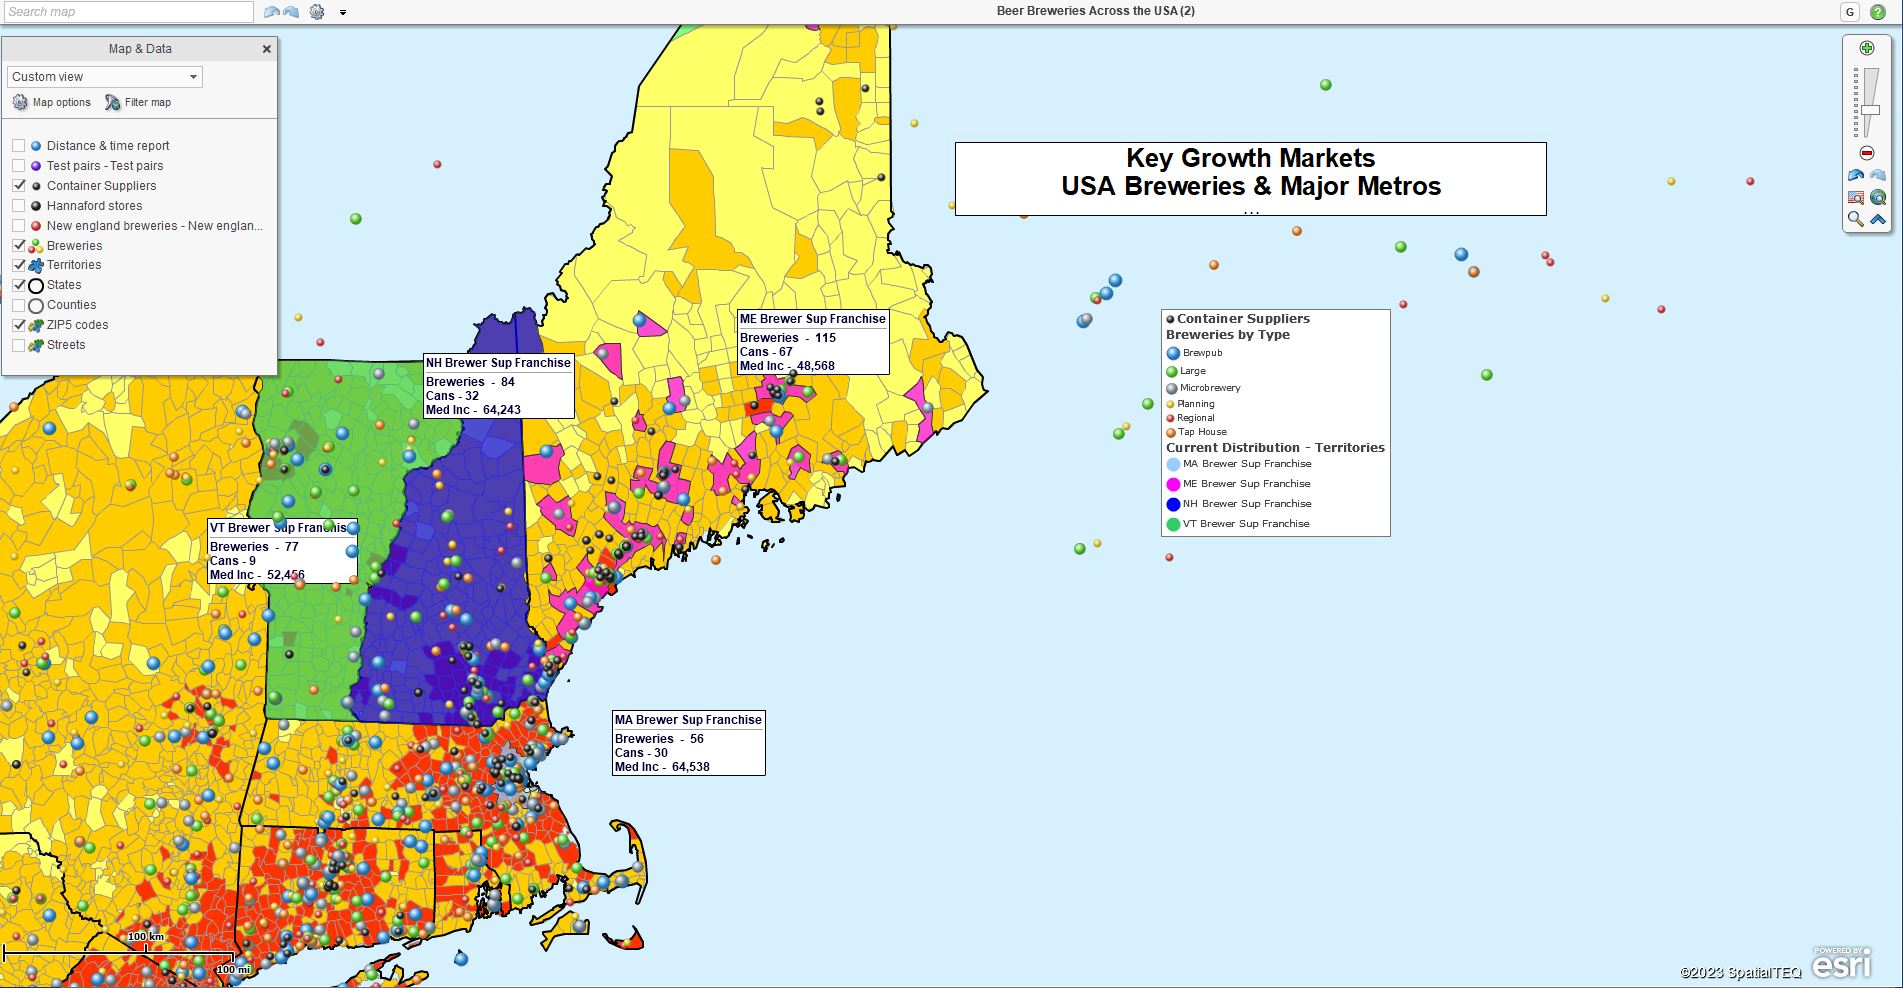
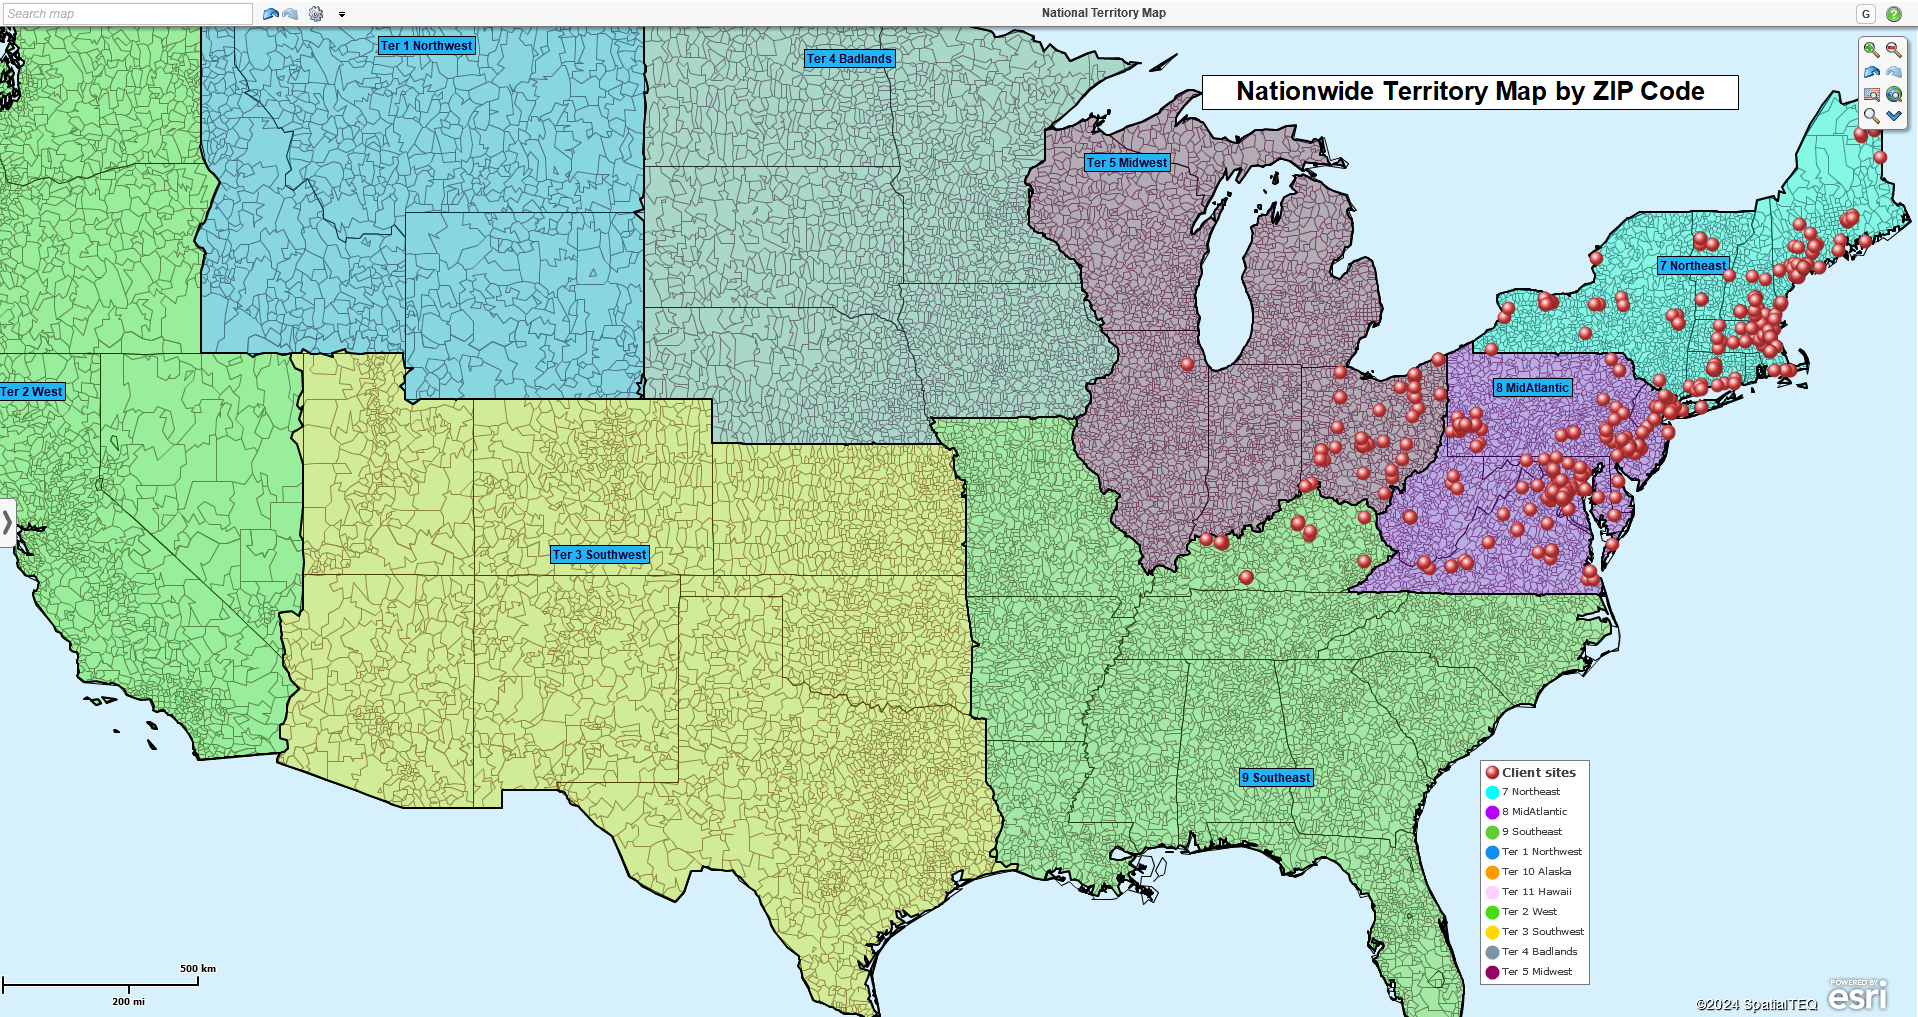
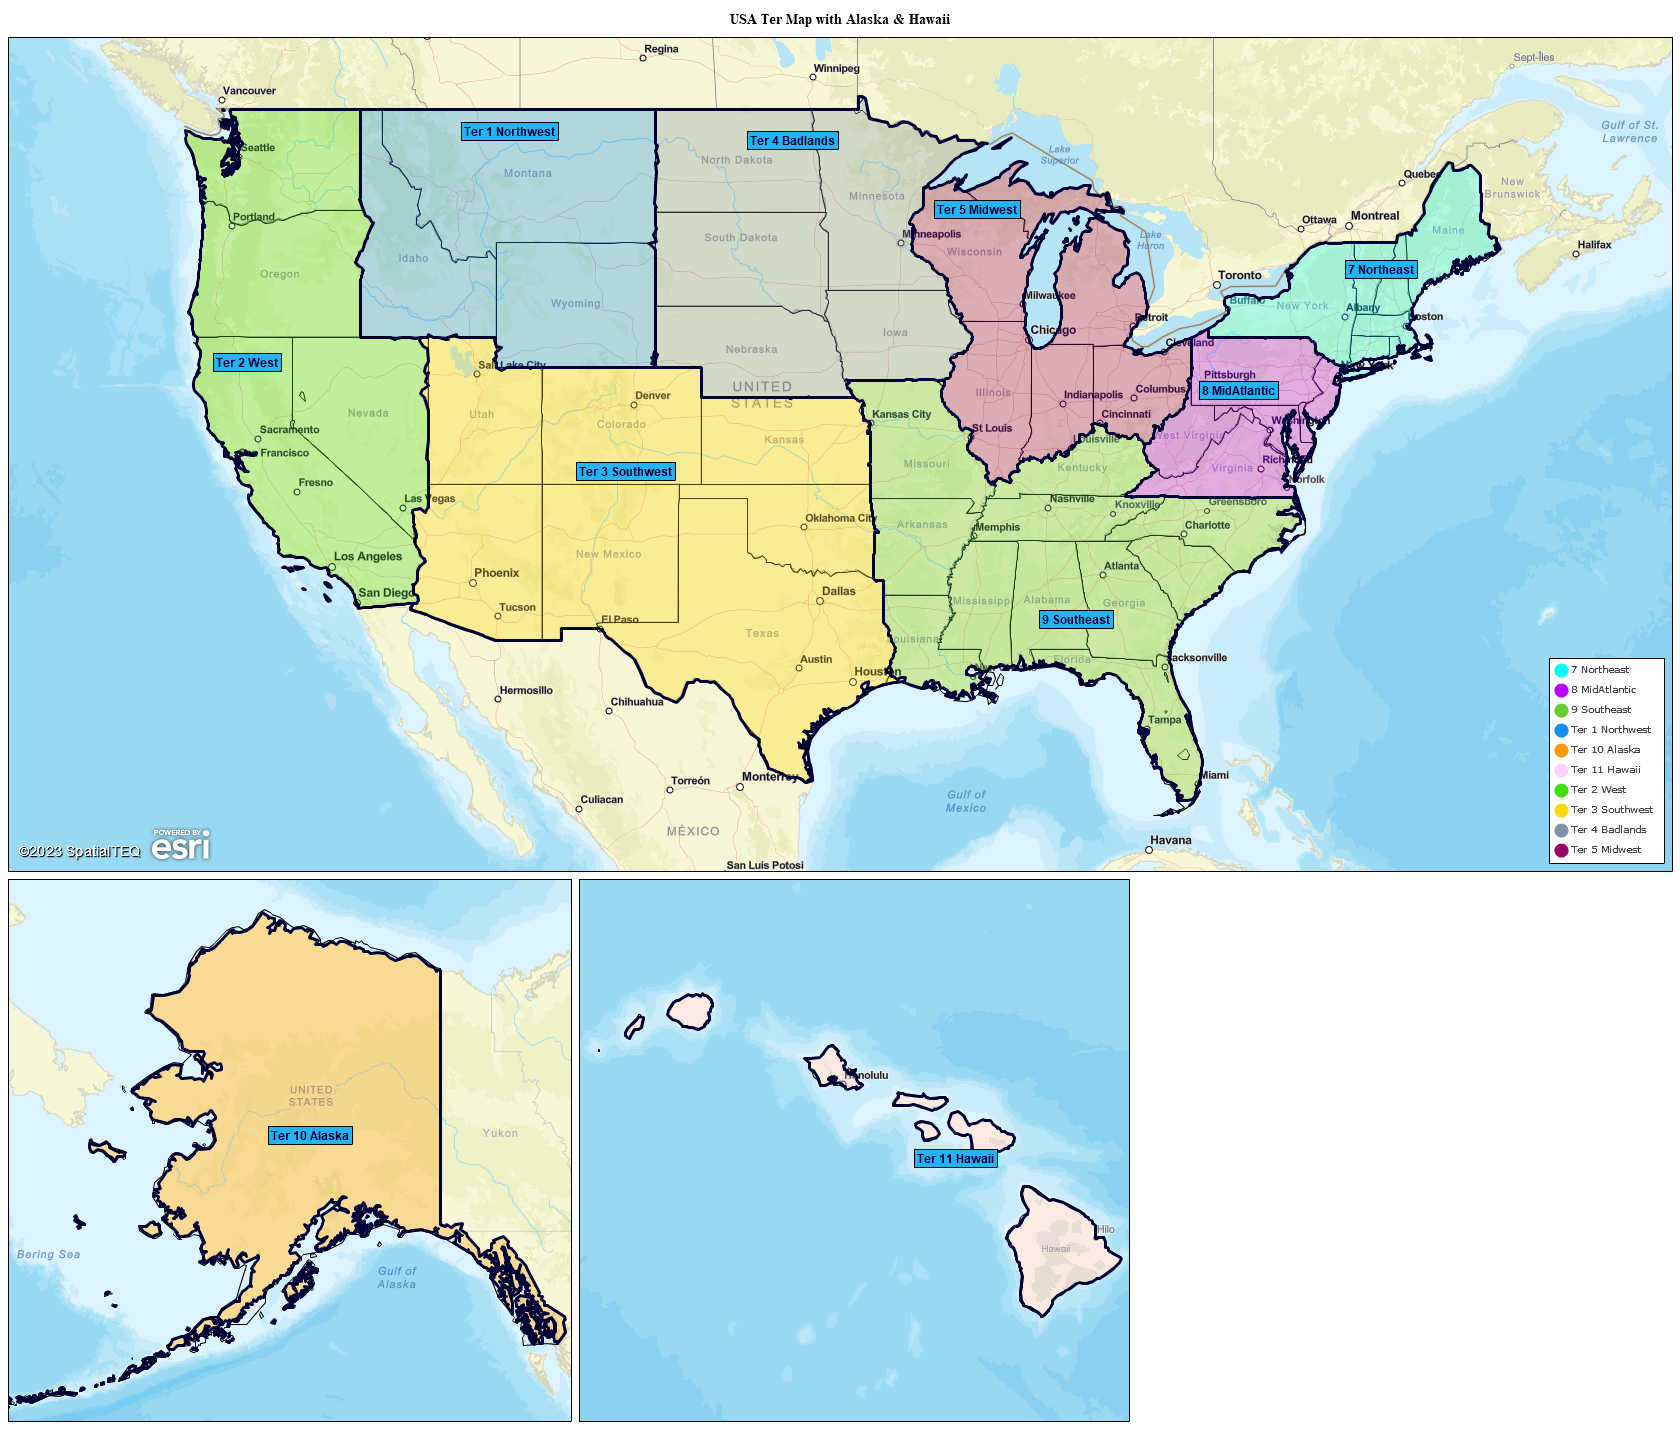
In addition to banks, insurance companies and franchise businesses use the territory mapping and market analysis capabilities of MapBusinessOnline Pro to control multiple aspects of their businesses, including:

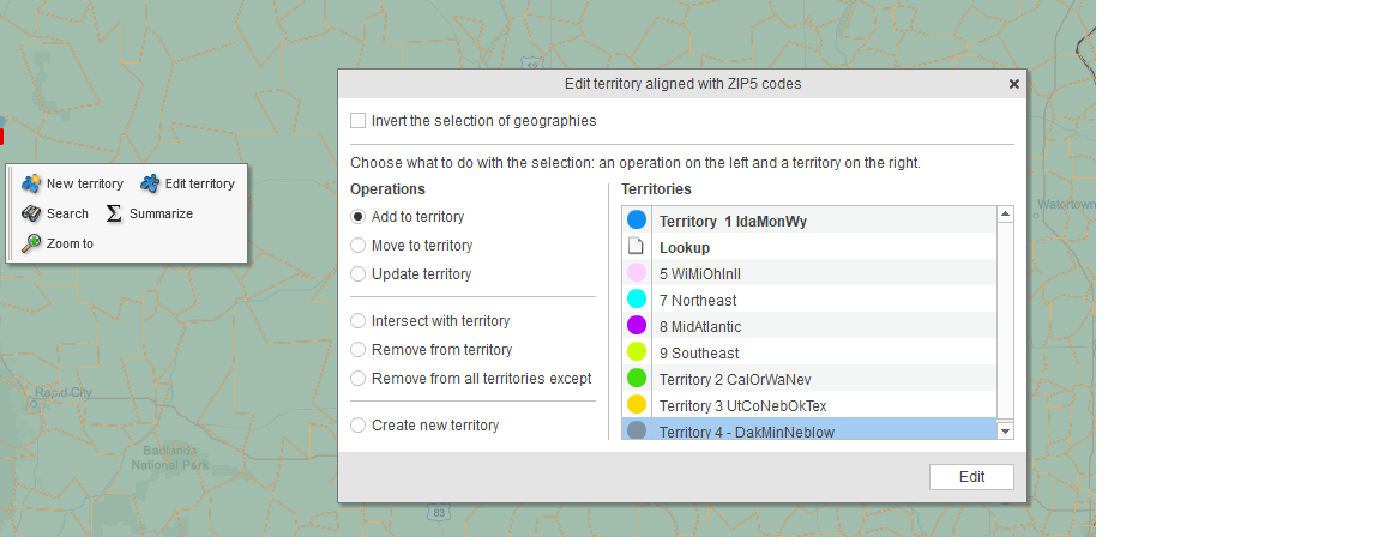
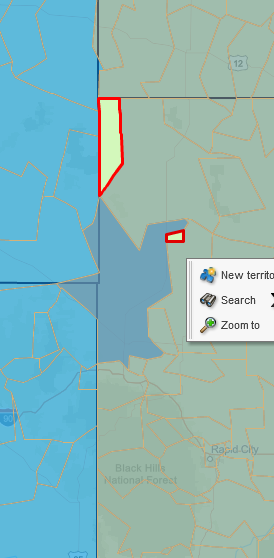
  • Managing field technicians and sales staff in the field using territory management tools.
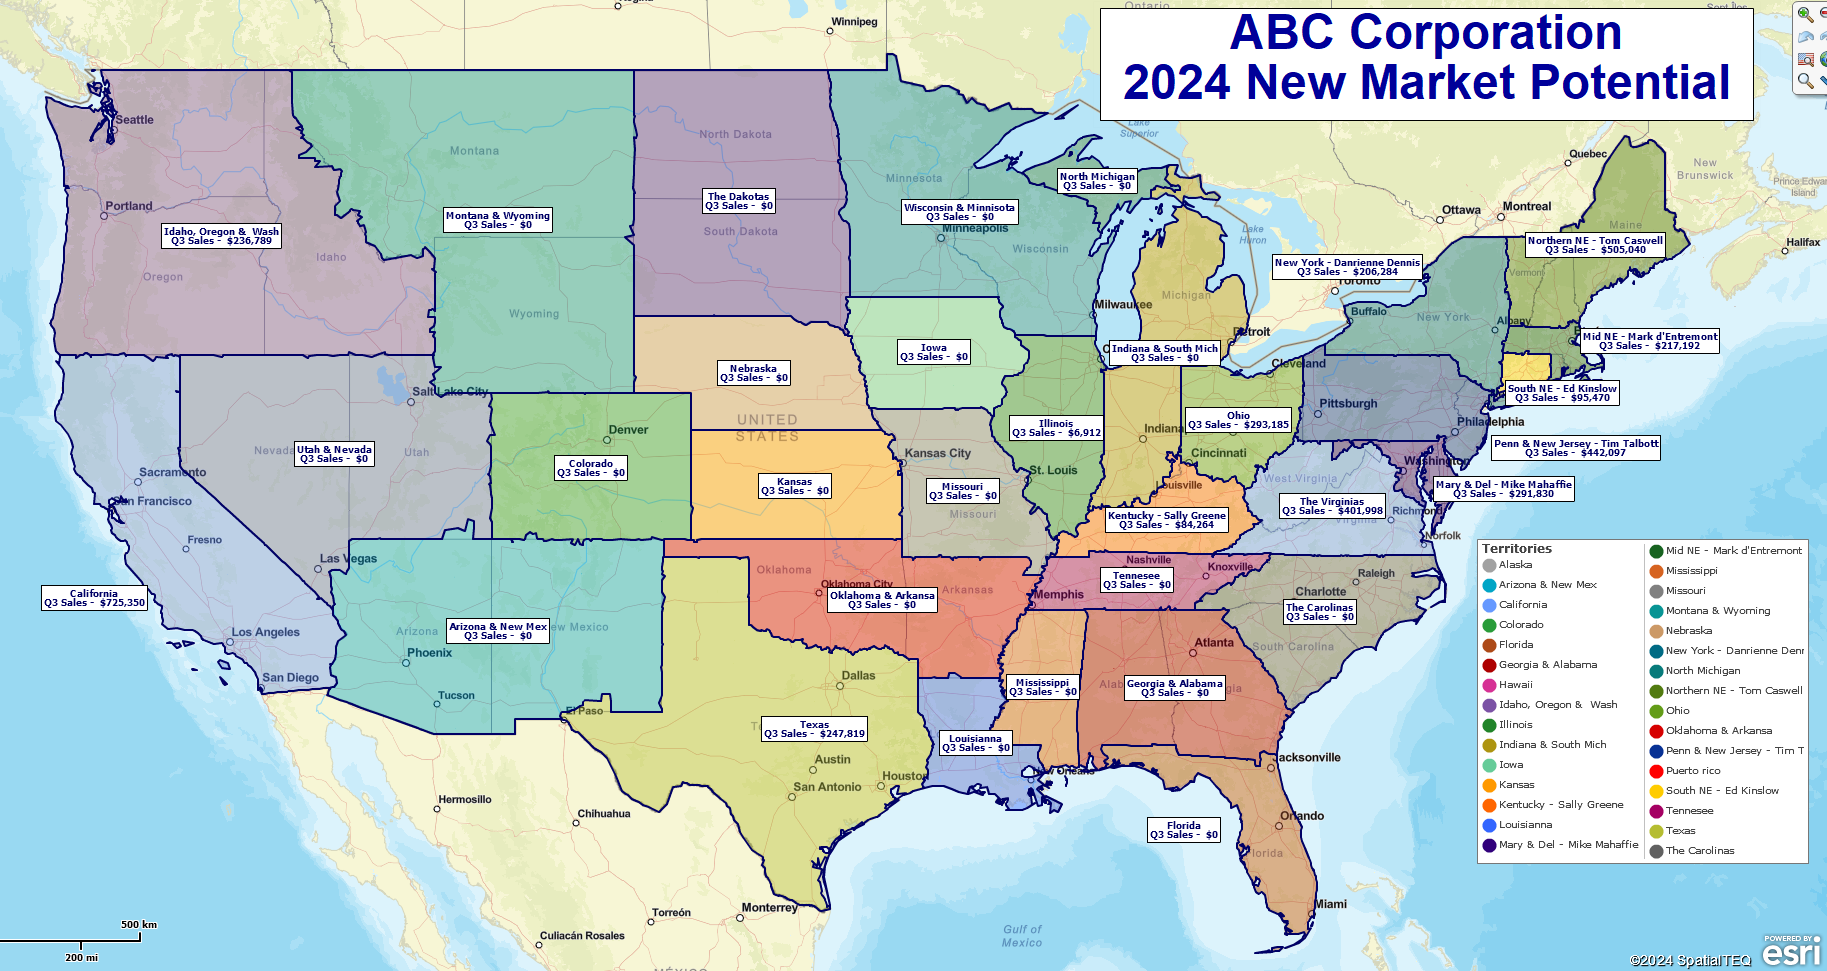
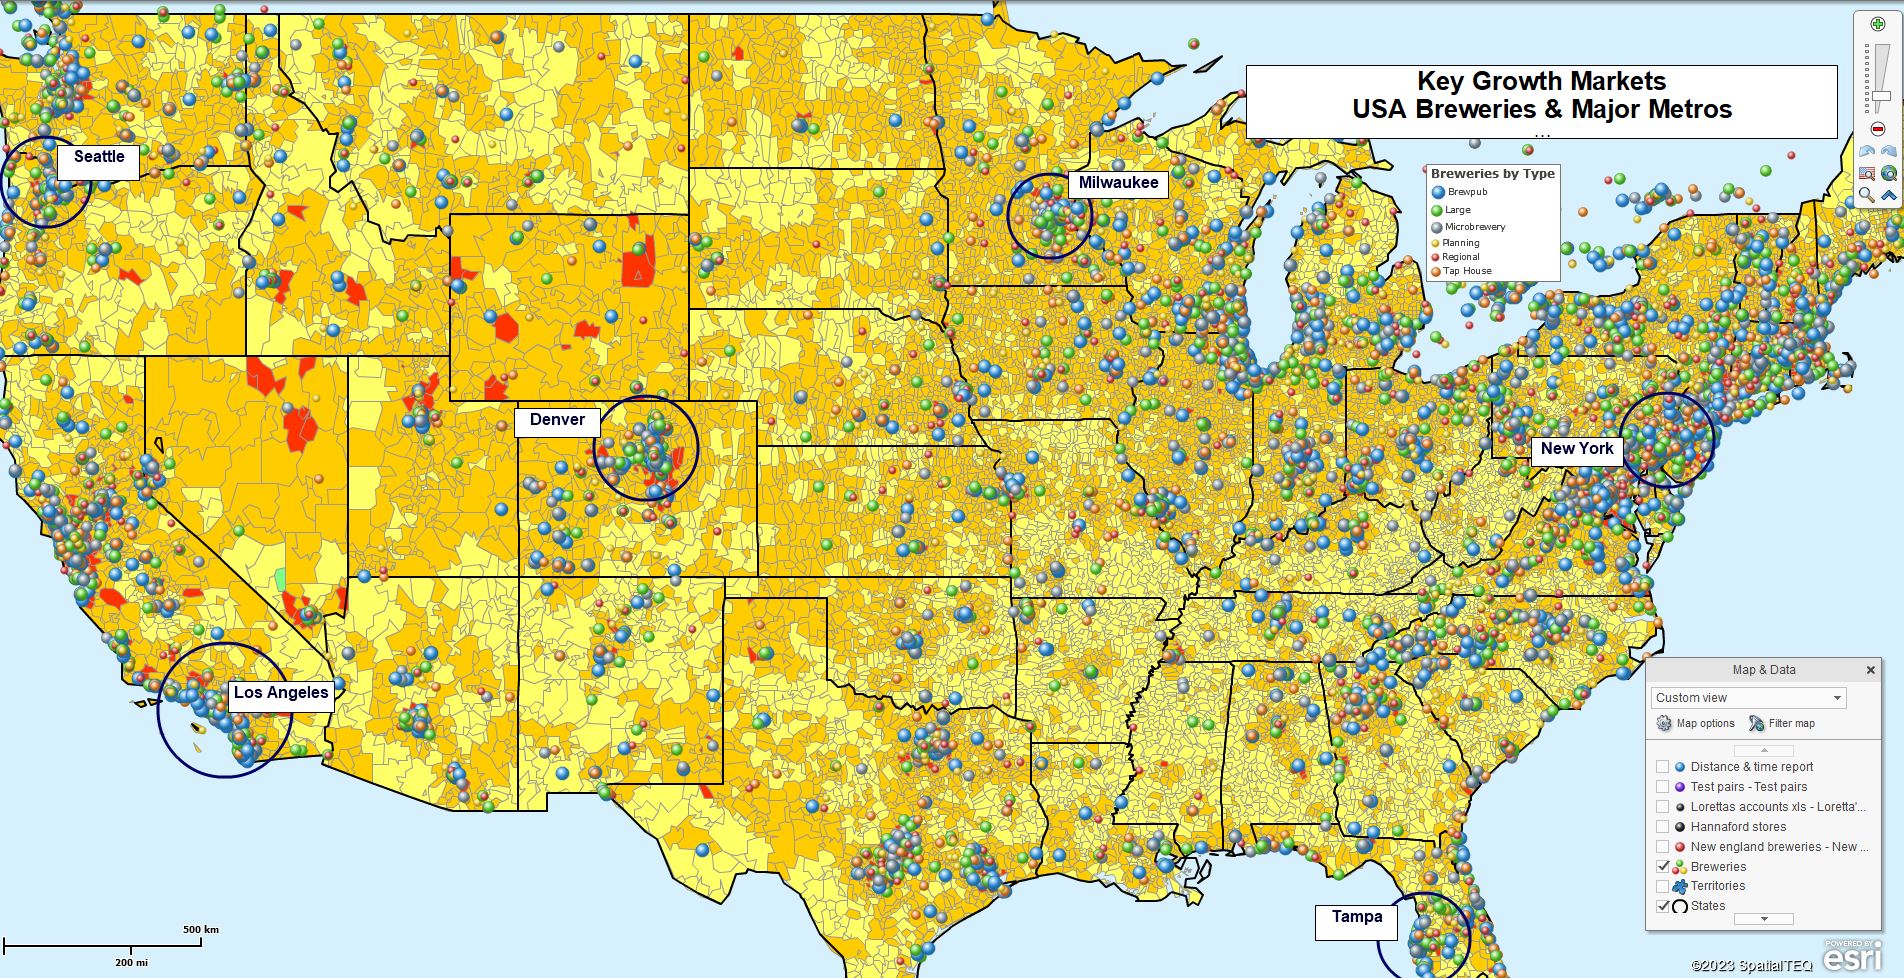
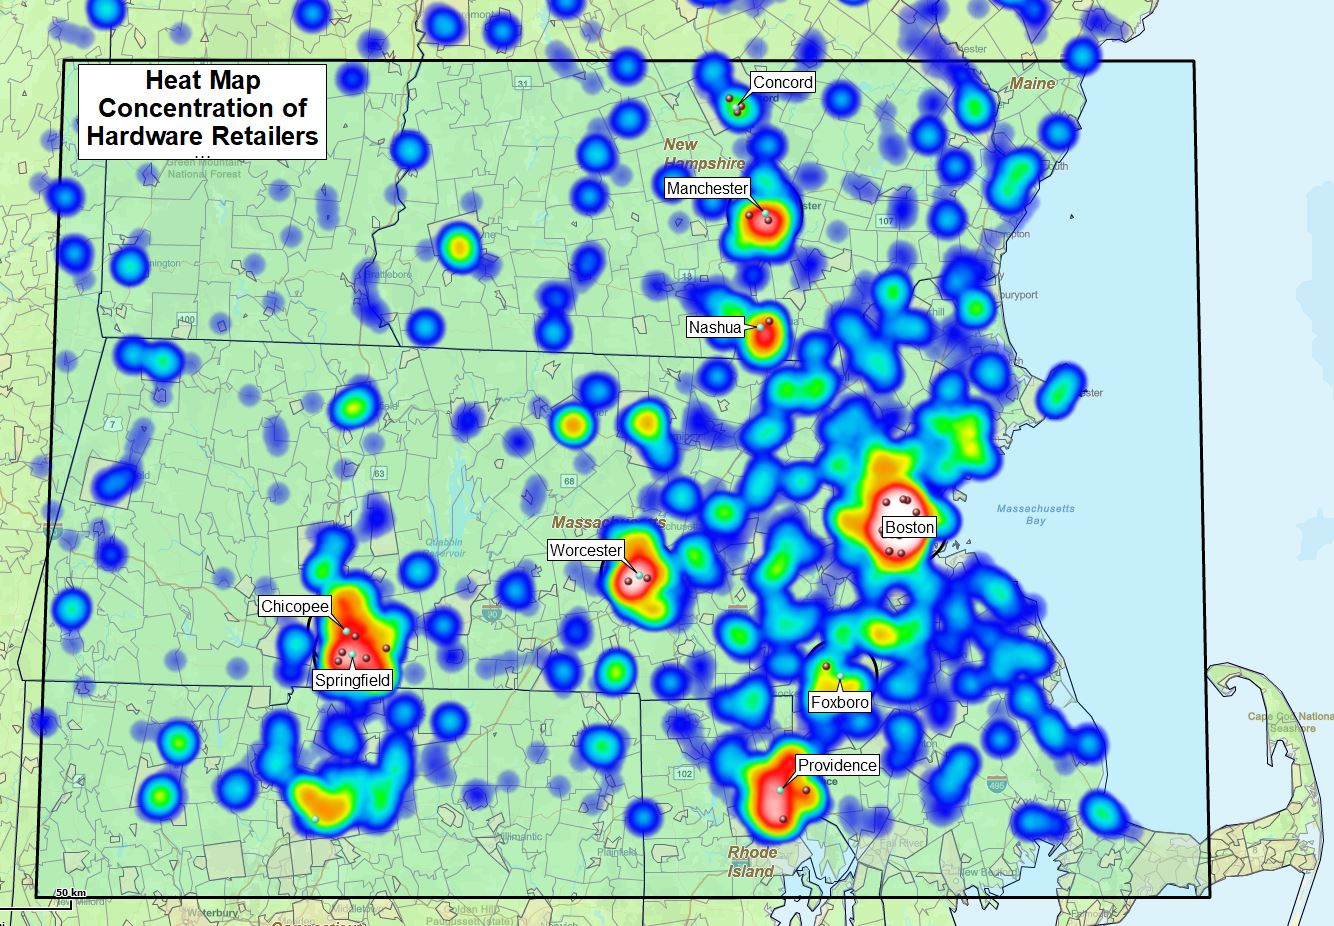
  • Finding new markets using map-based market analysis based on actual sell-through data.
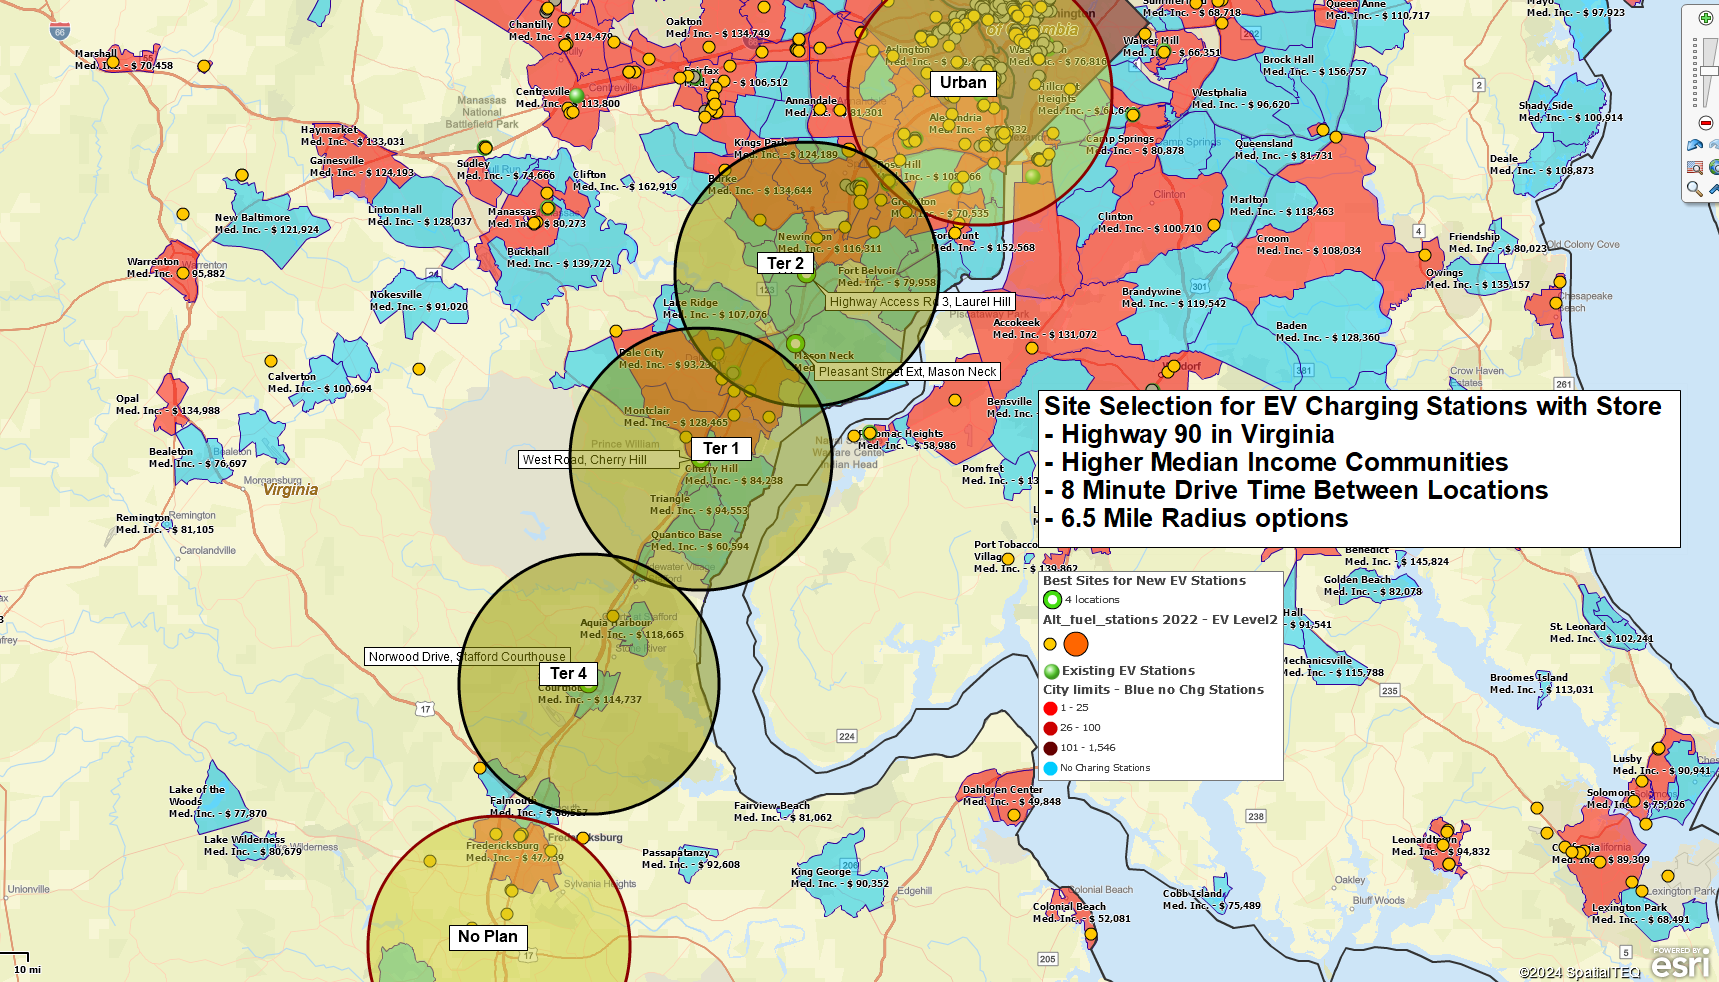
  • Examining expansion opportunities and fine-tuning site selection.
  • Avoid sales staff frustration and balance workloads by controlling sales overlap.
  • Informing the sales team or strategy meetings using map visualizations.

Franchise Business Challenges

Of course, a ‘franchise business’ covers a lot of ground. That’s because franchises could be:

  • Restaurant businesses – A series of restaurants sold to franchisees from city to city, such as McDonald’s.
  • A set of retail product(s) sold through franchisee stores like Ace Hardware.
  • A service business. There are thousands. Think The UPS Store, Anytime Fitness, or Tattoo Removals R Us.

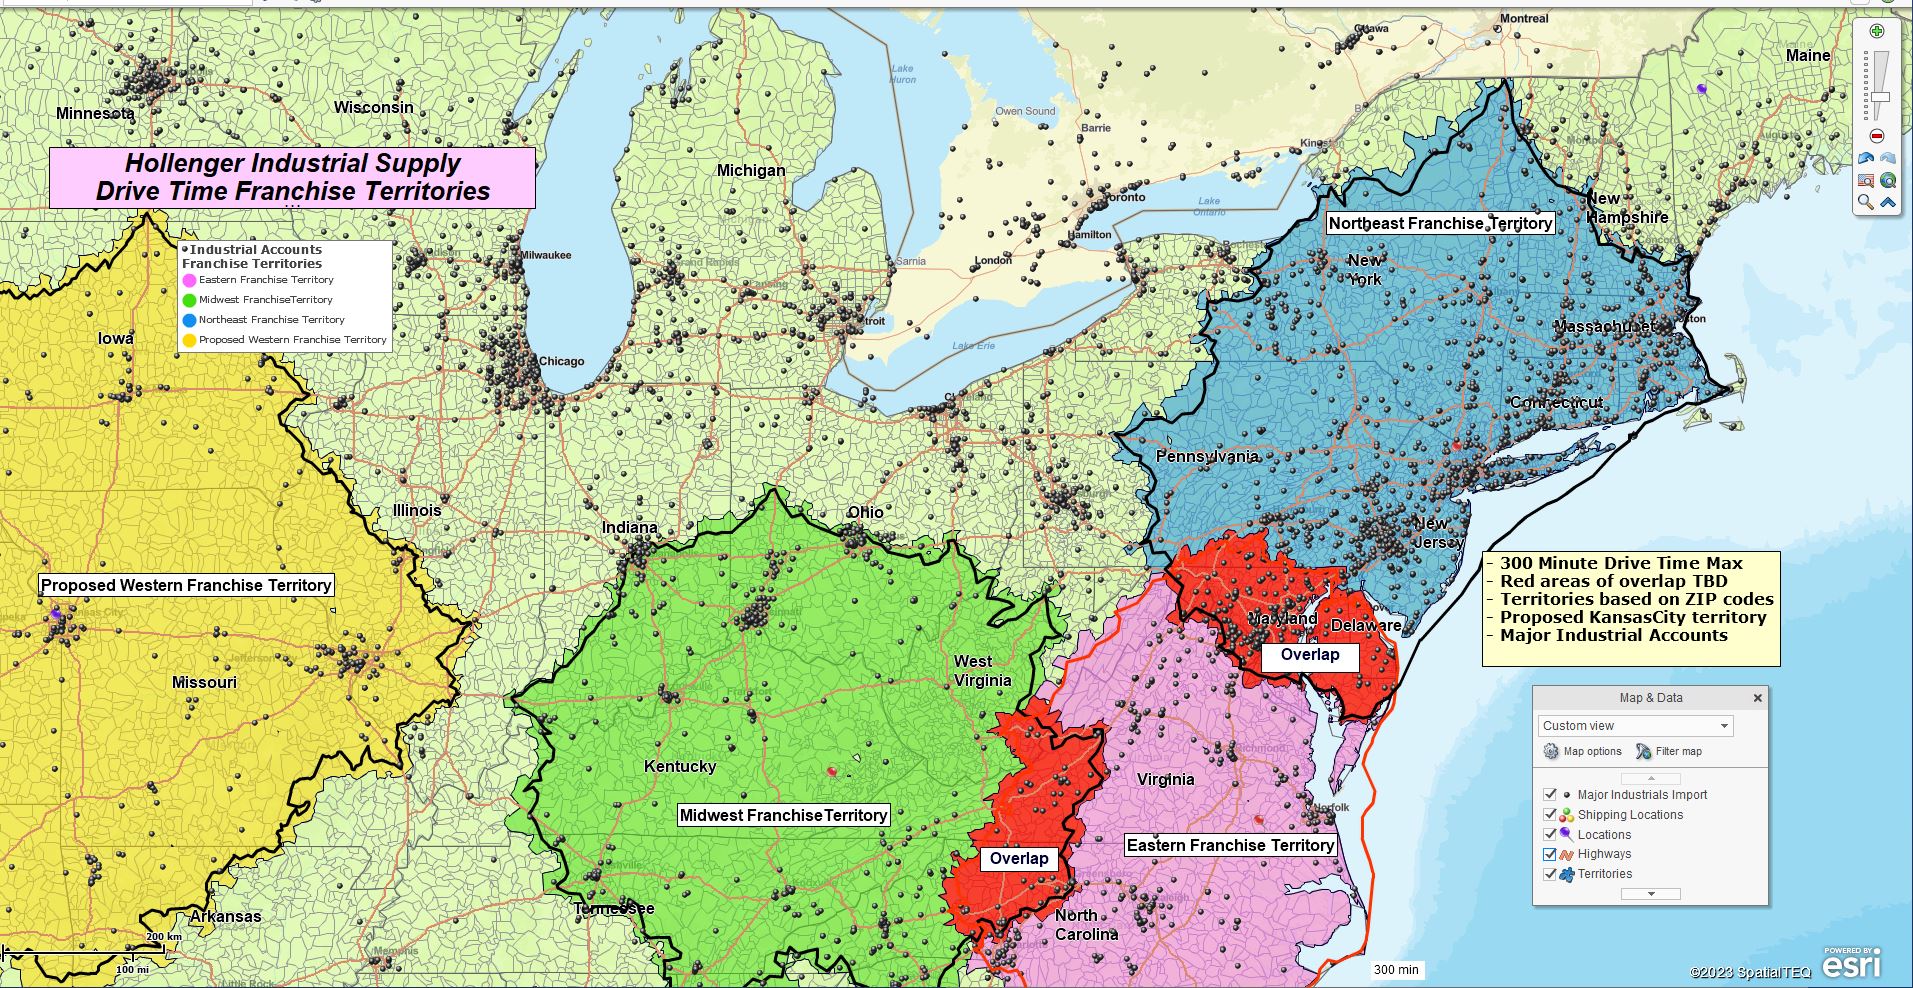
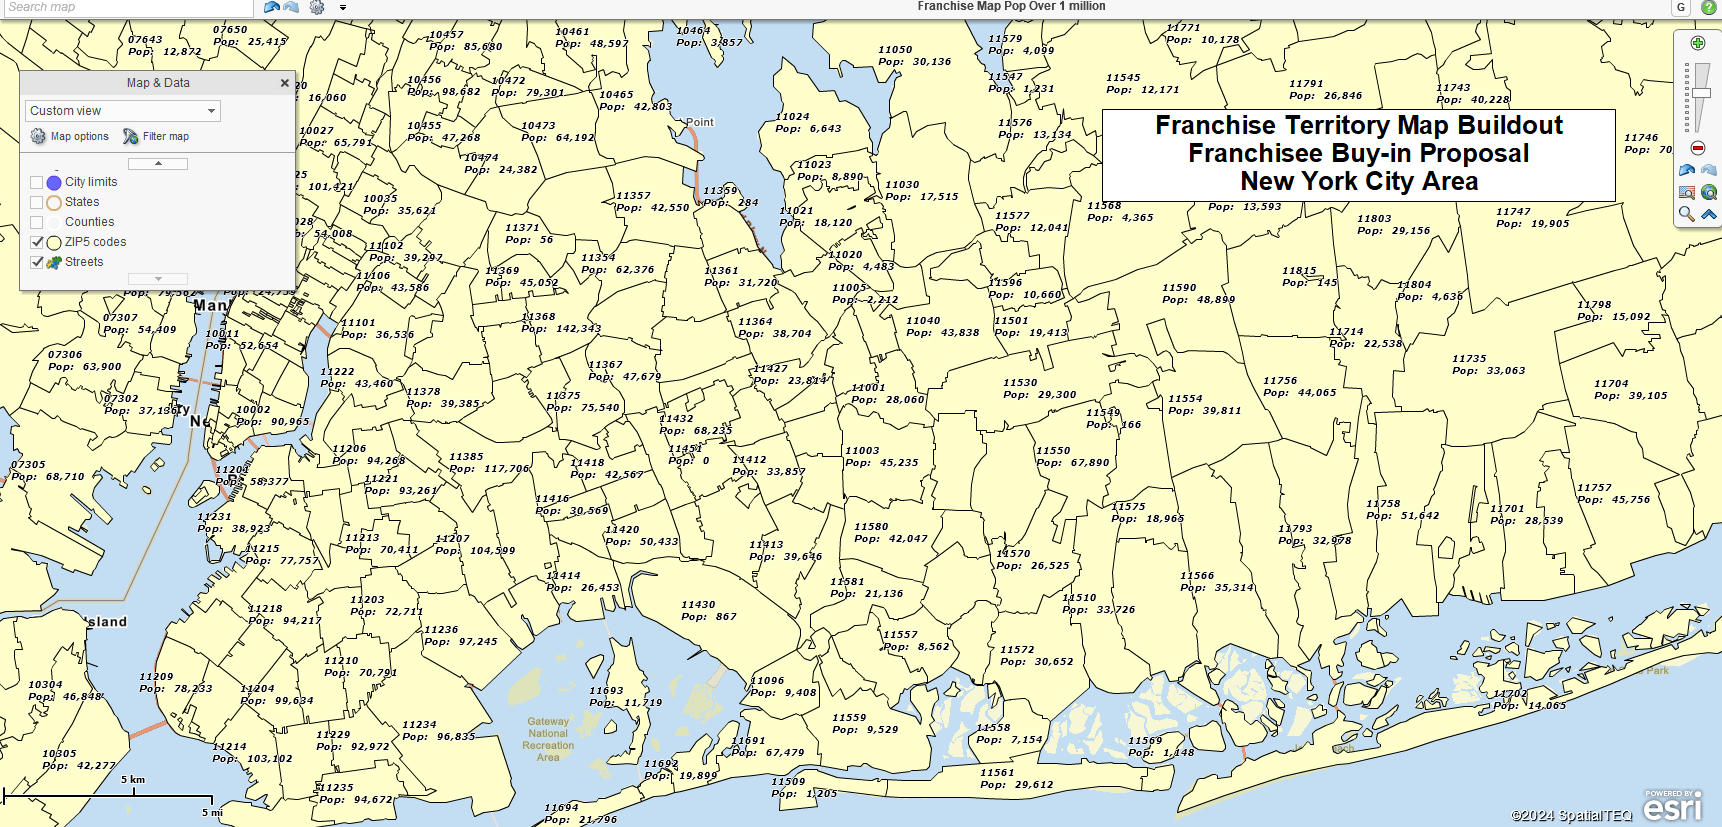
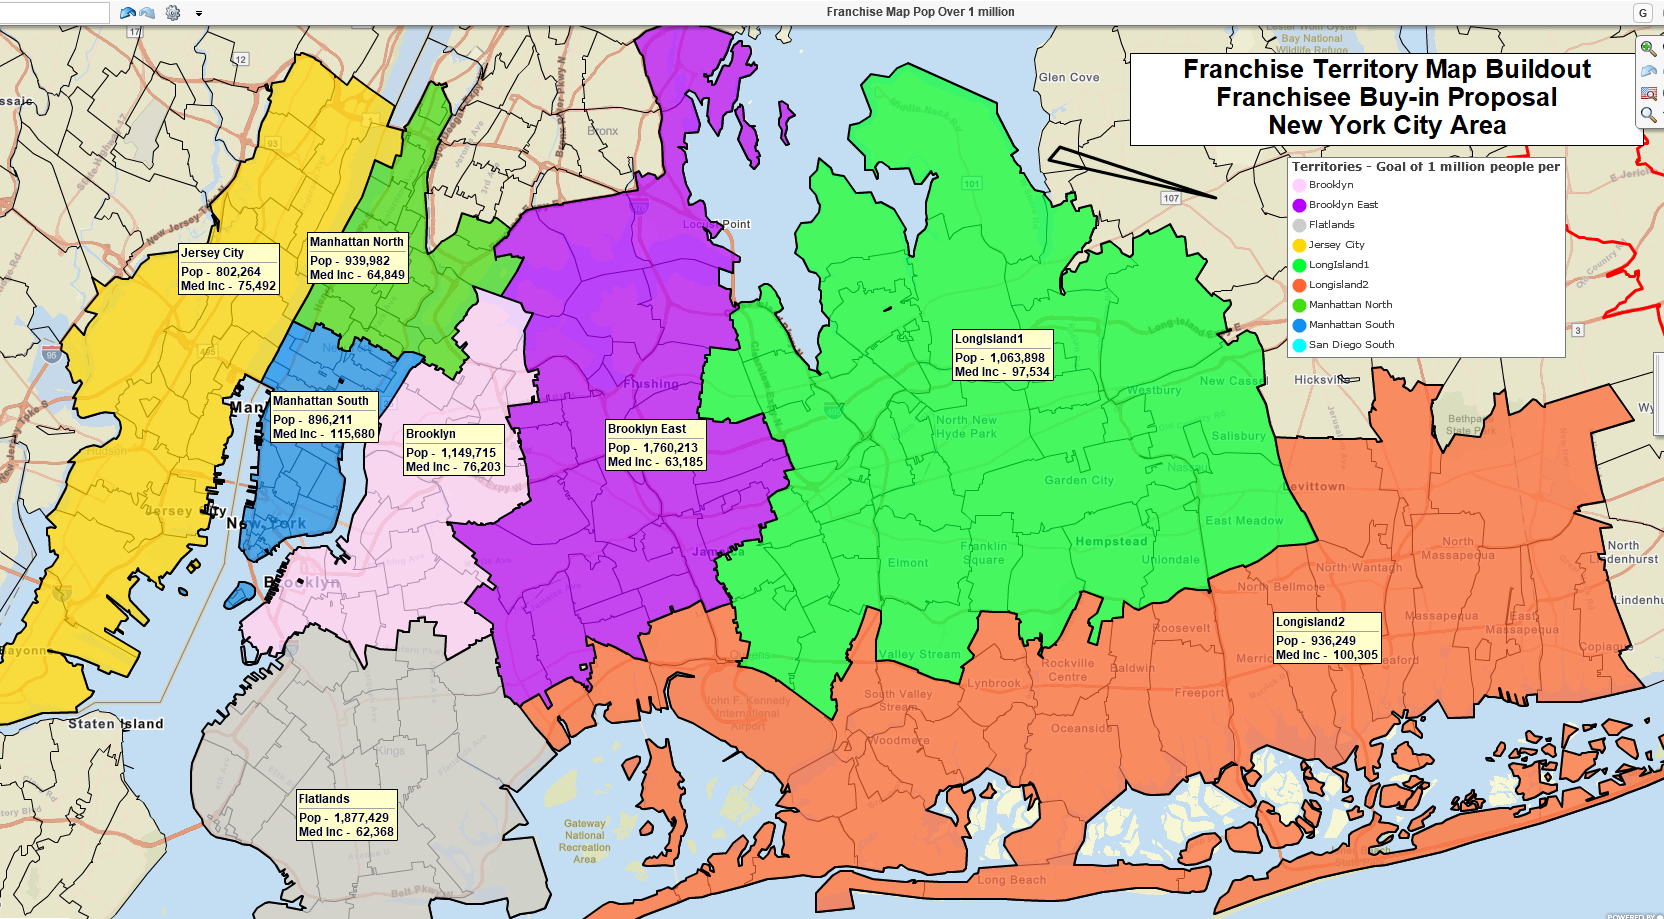
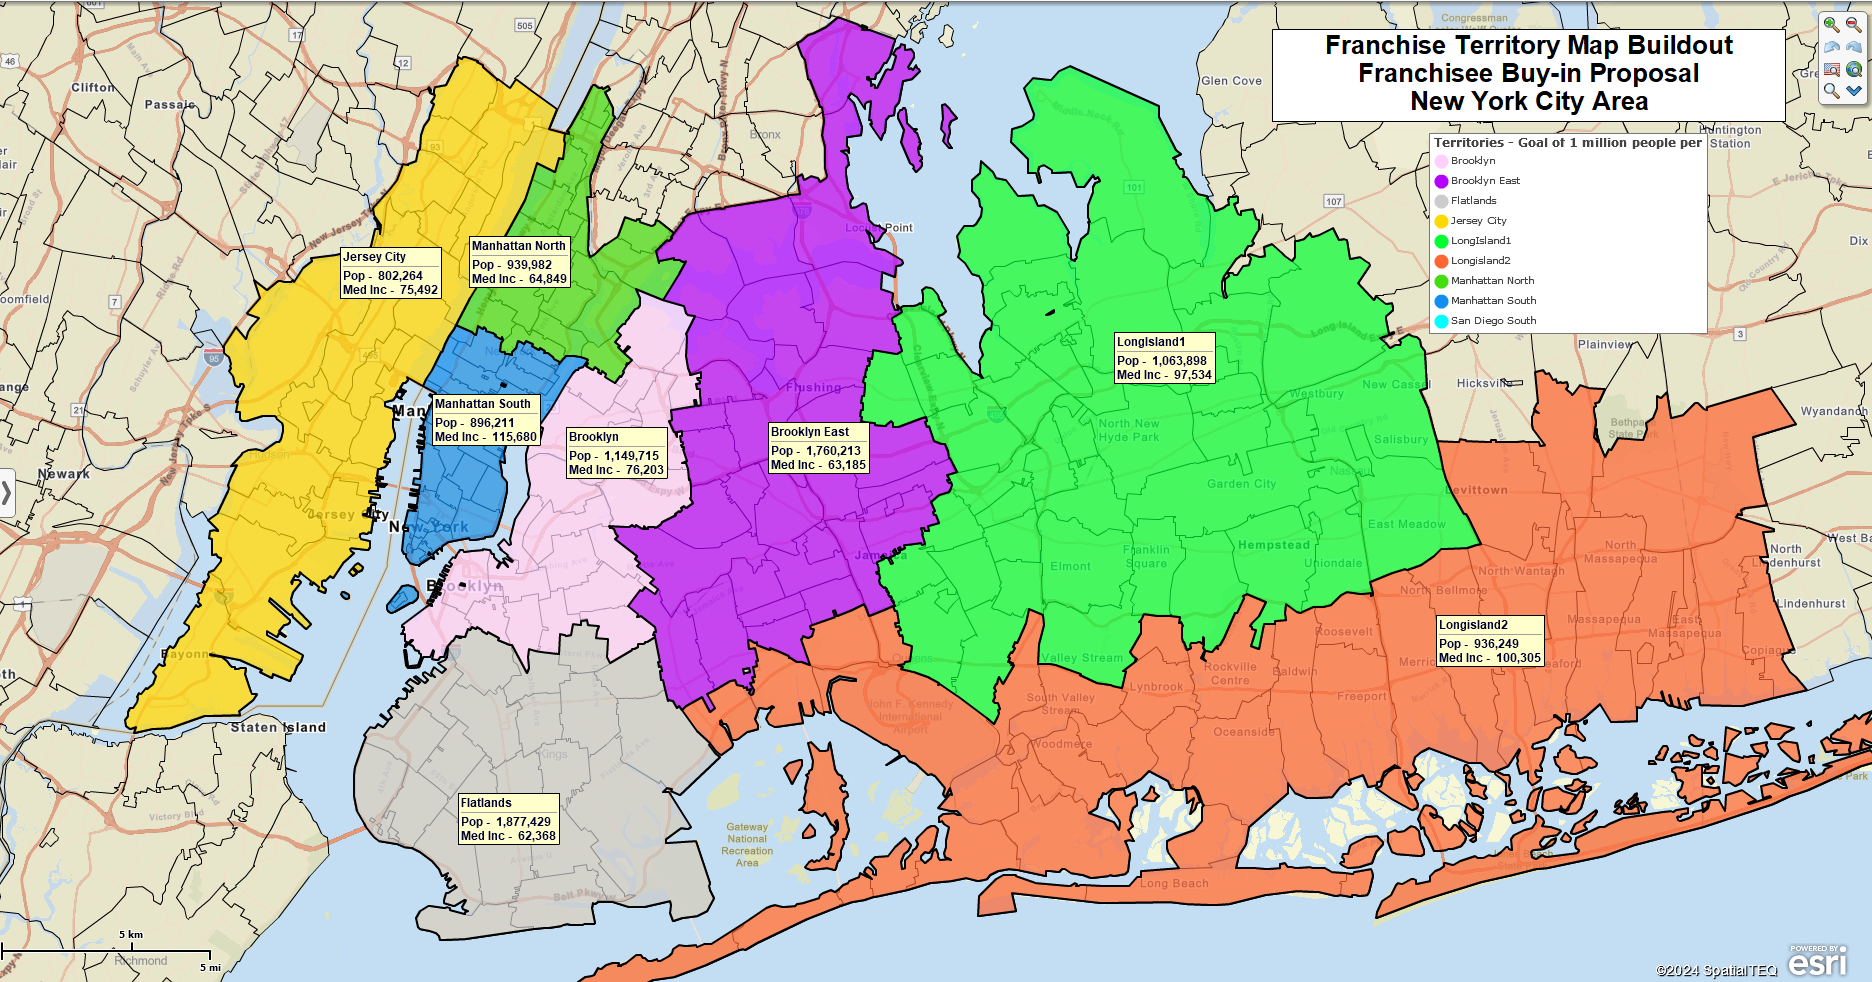
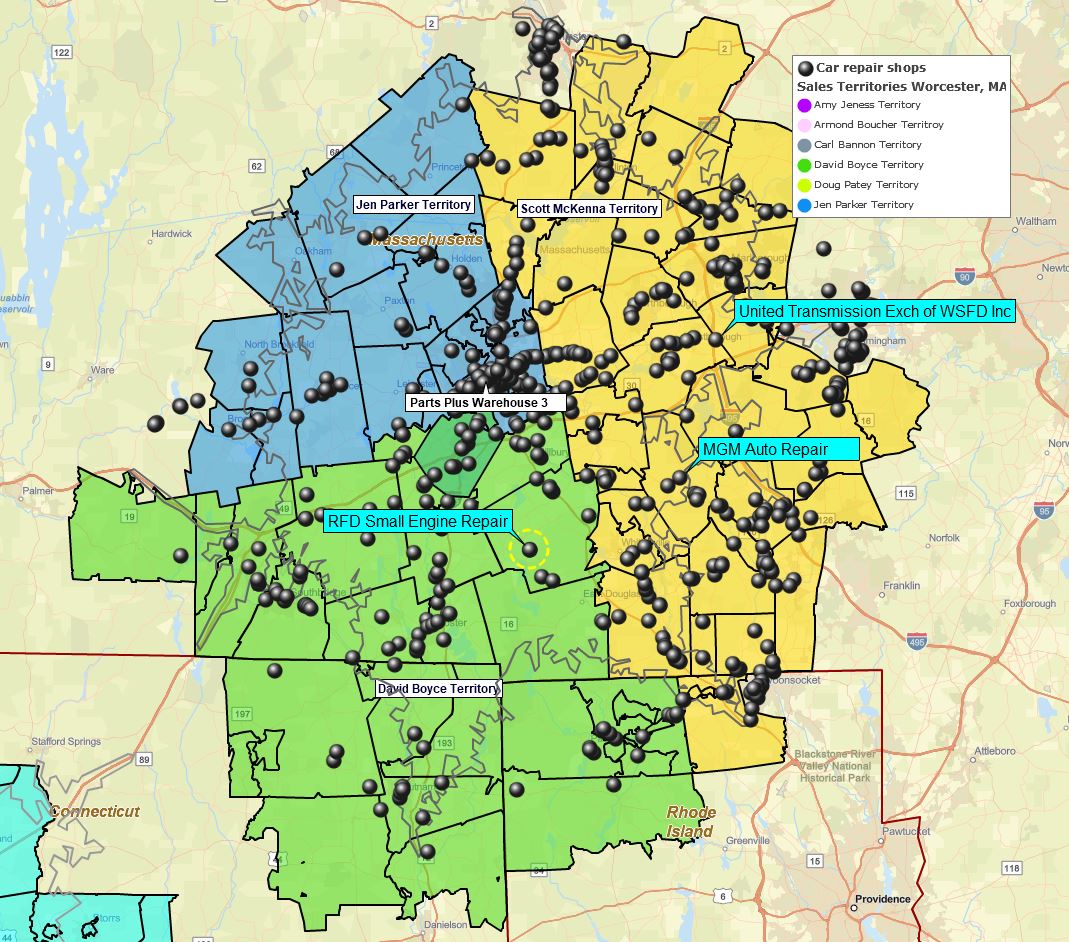
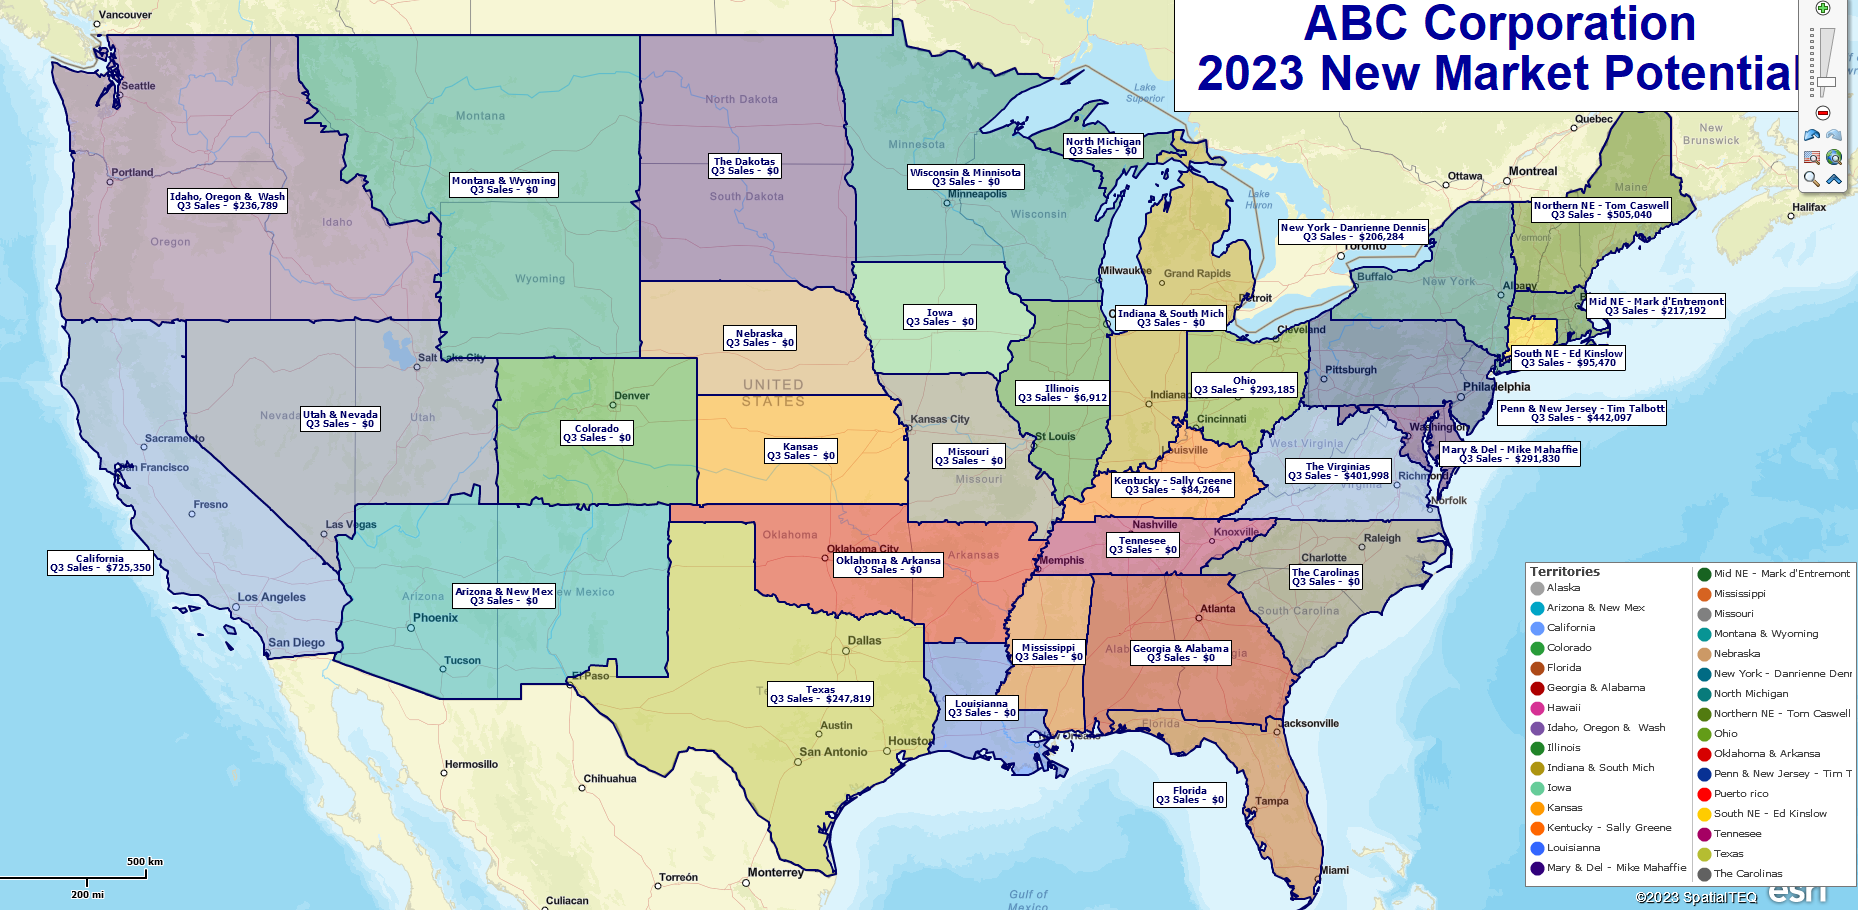
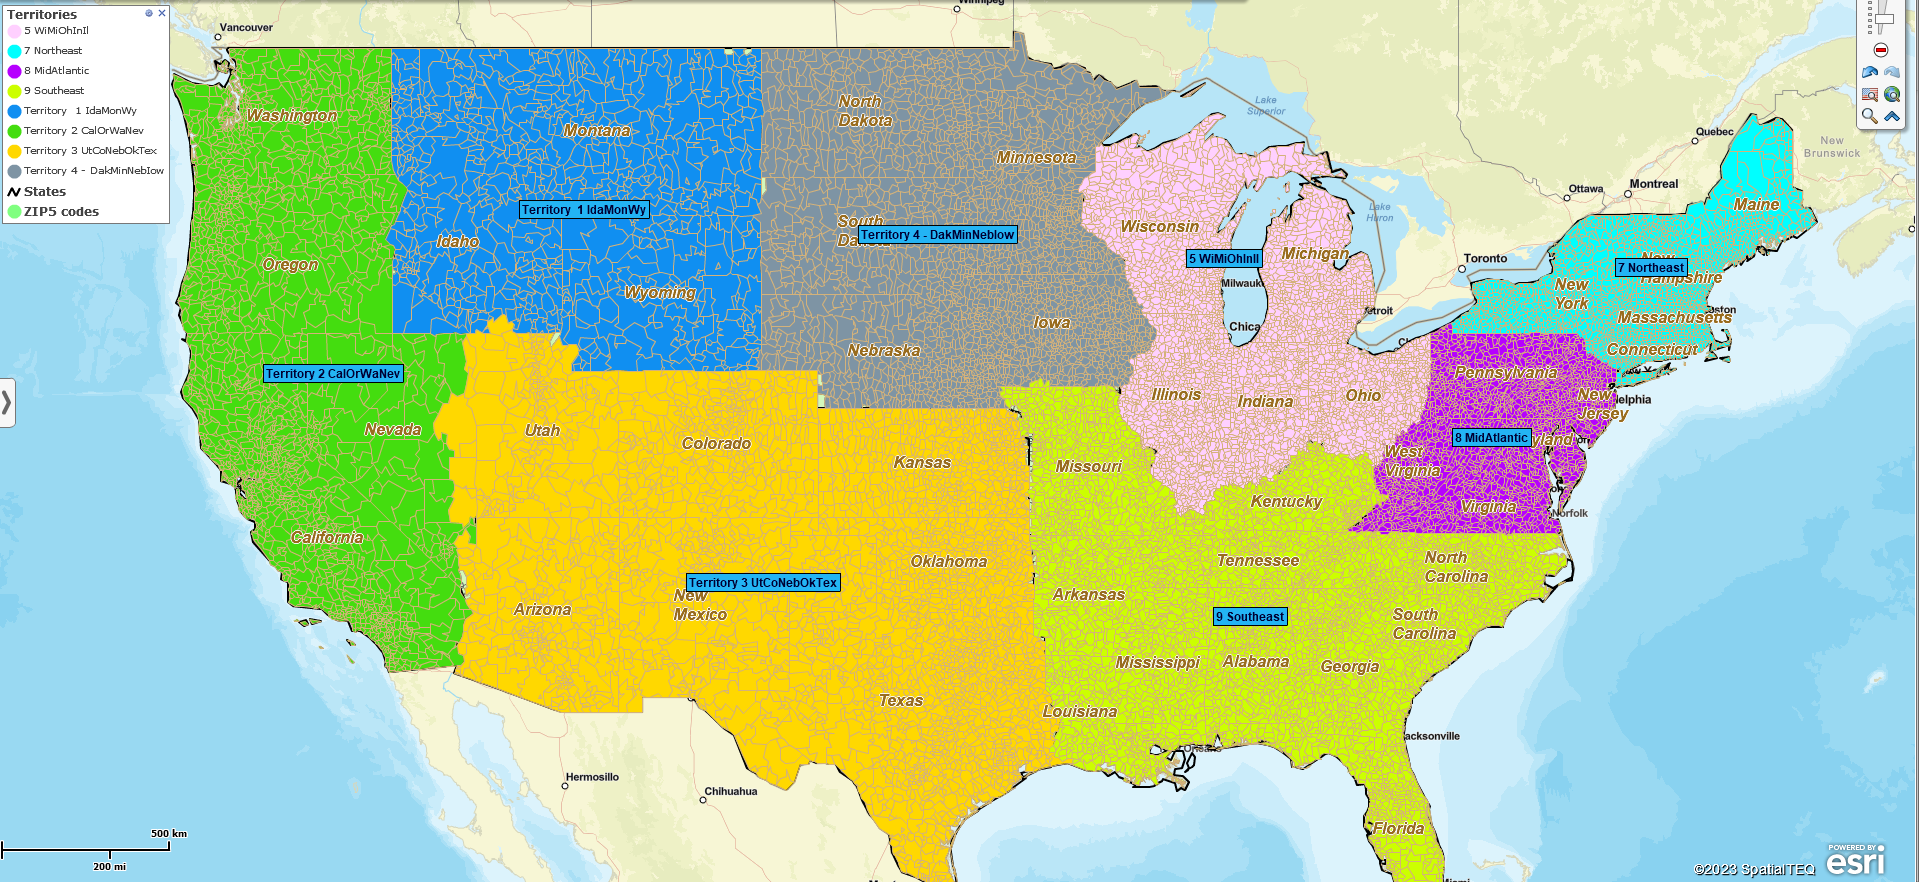
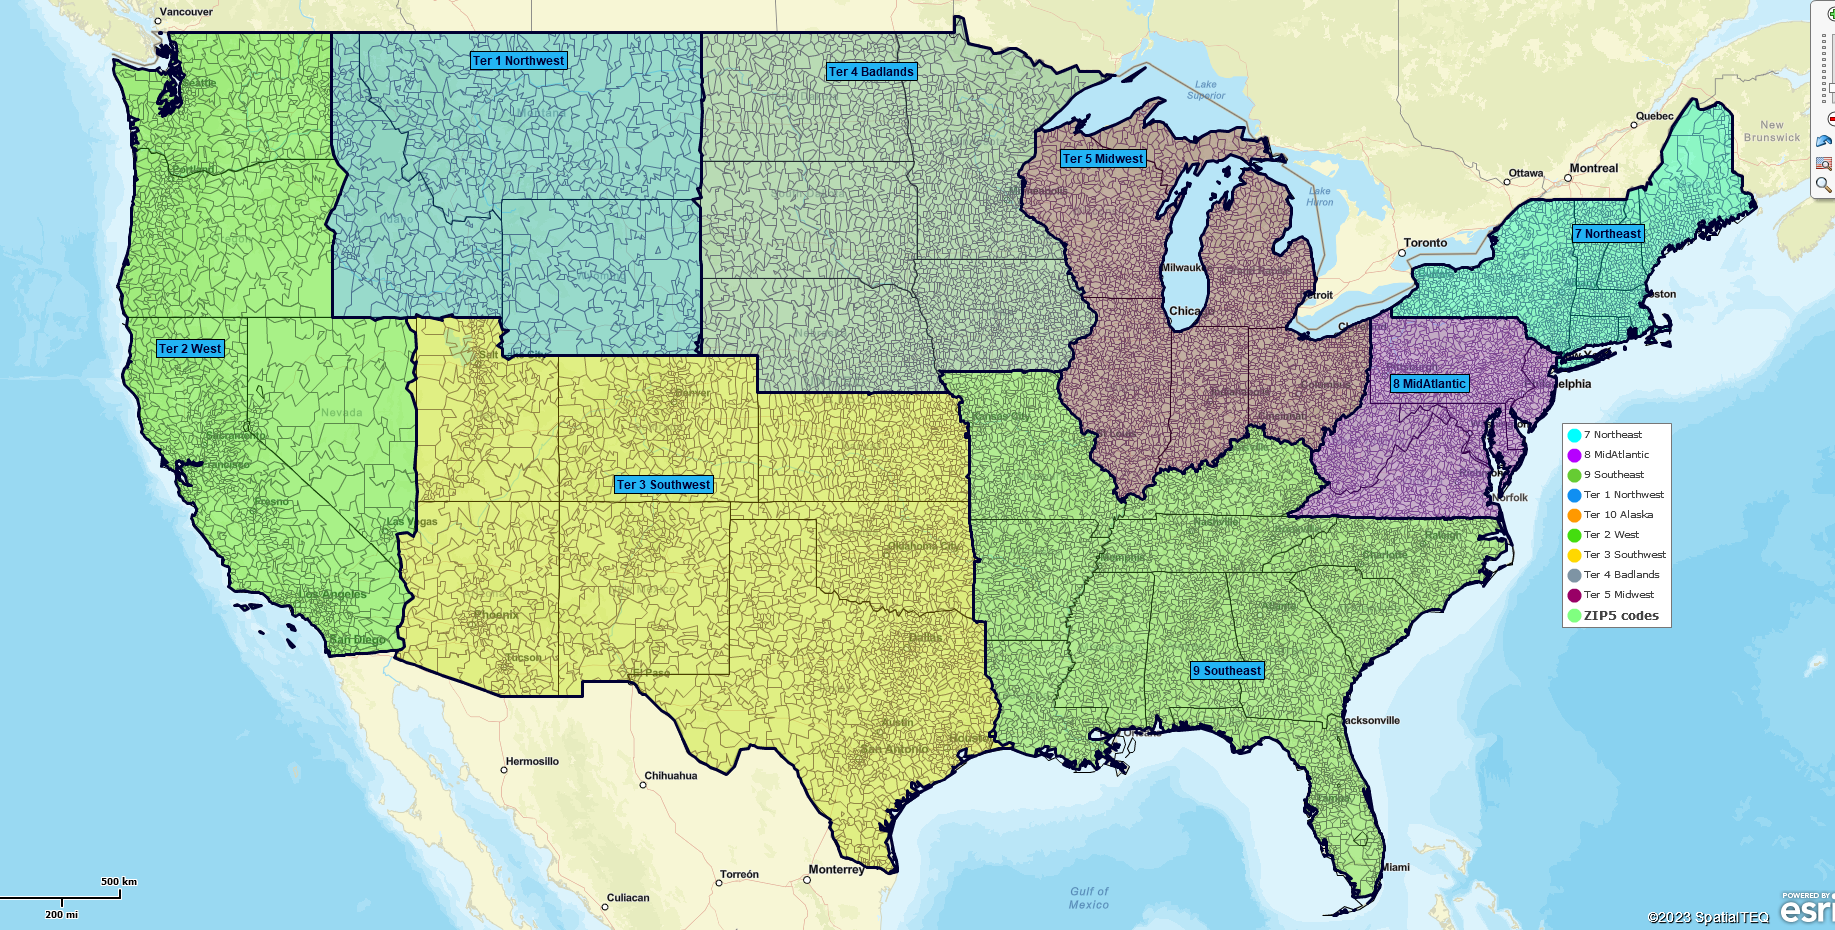
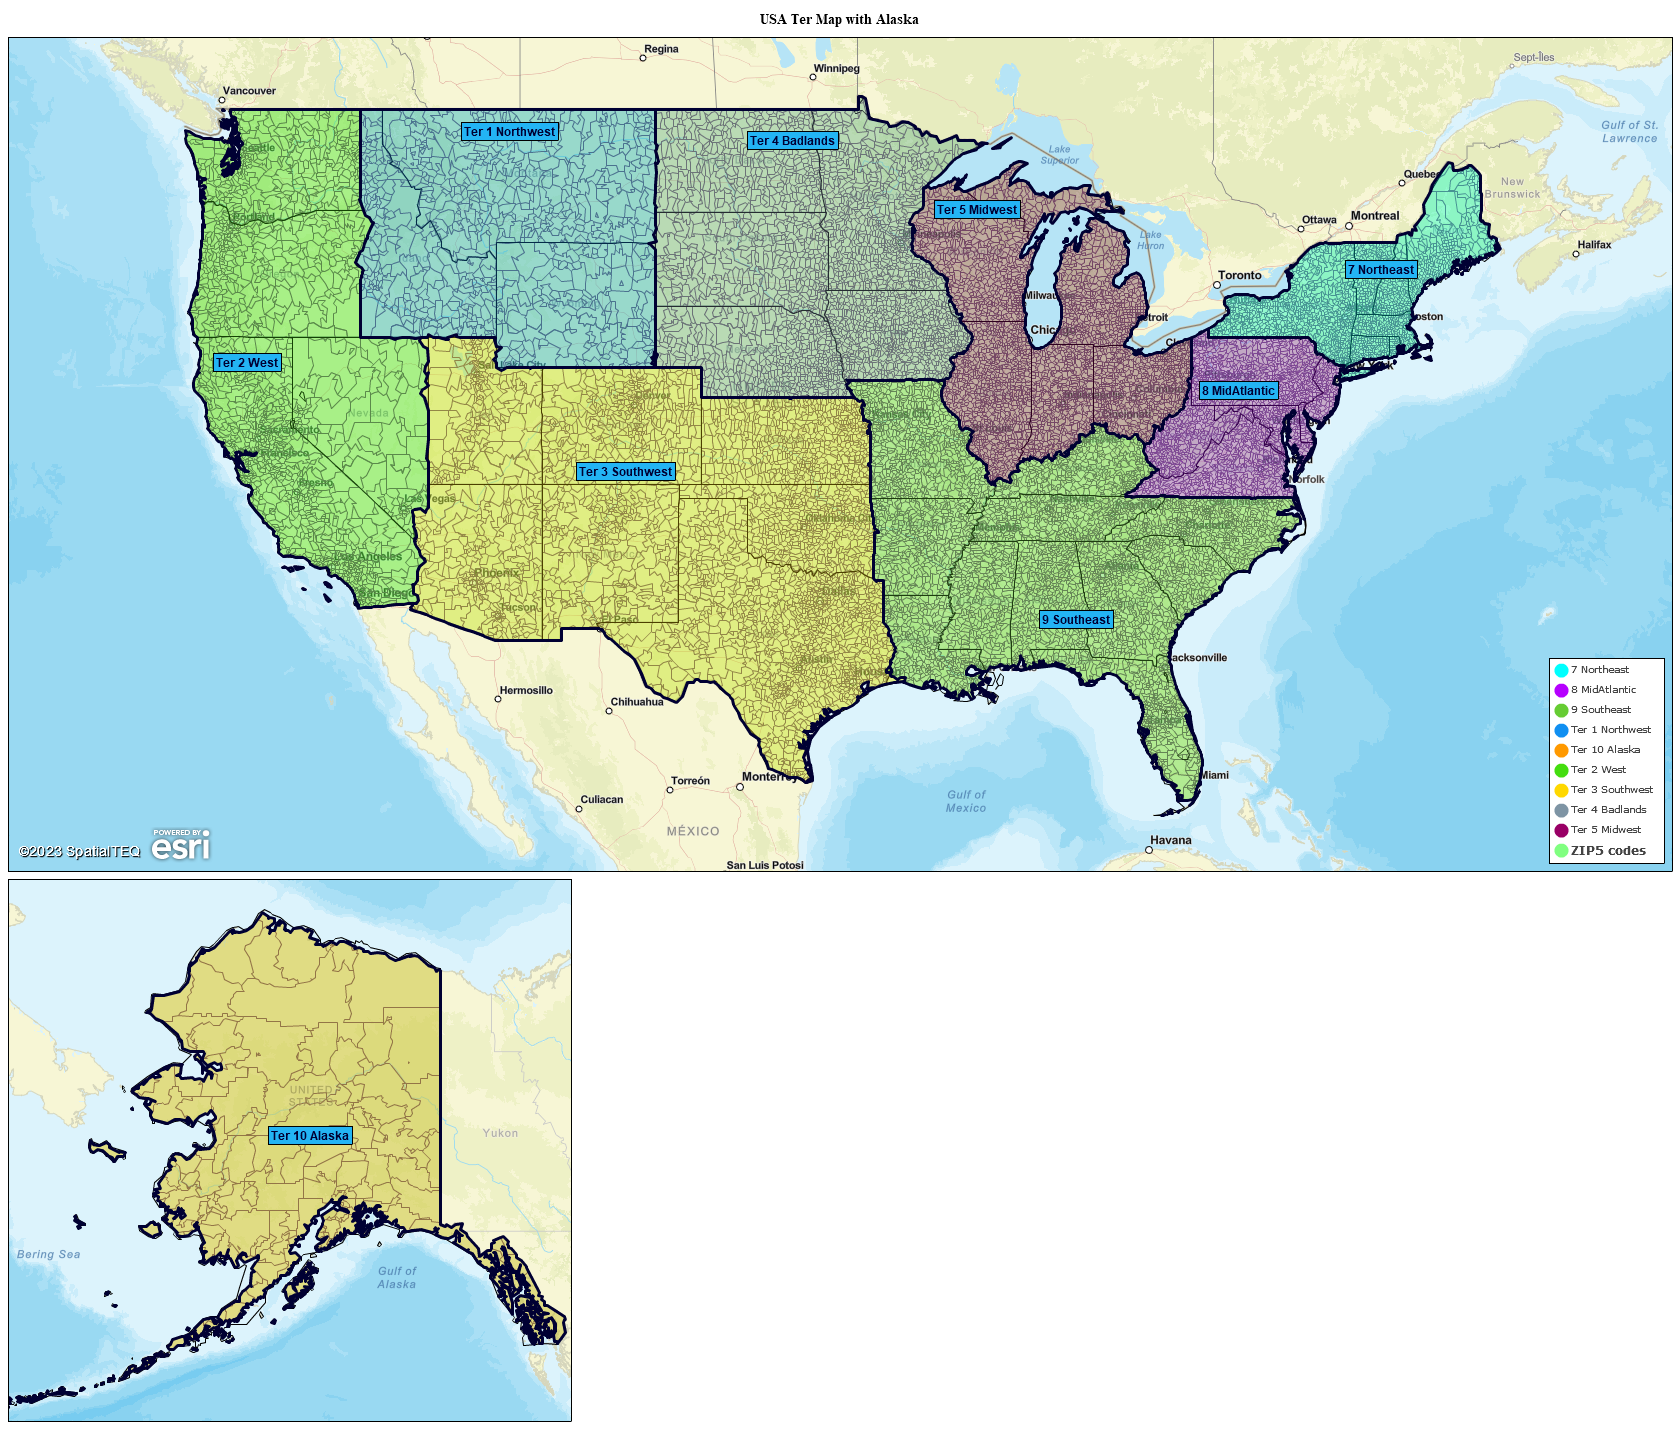
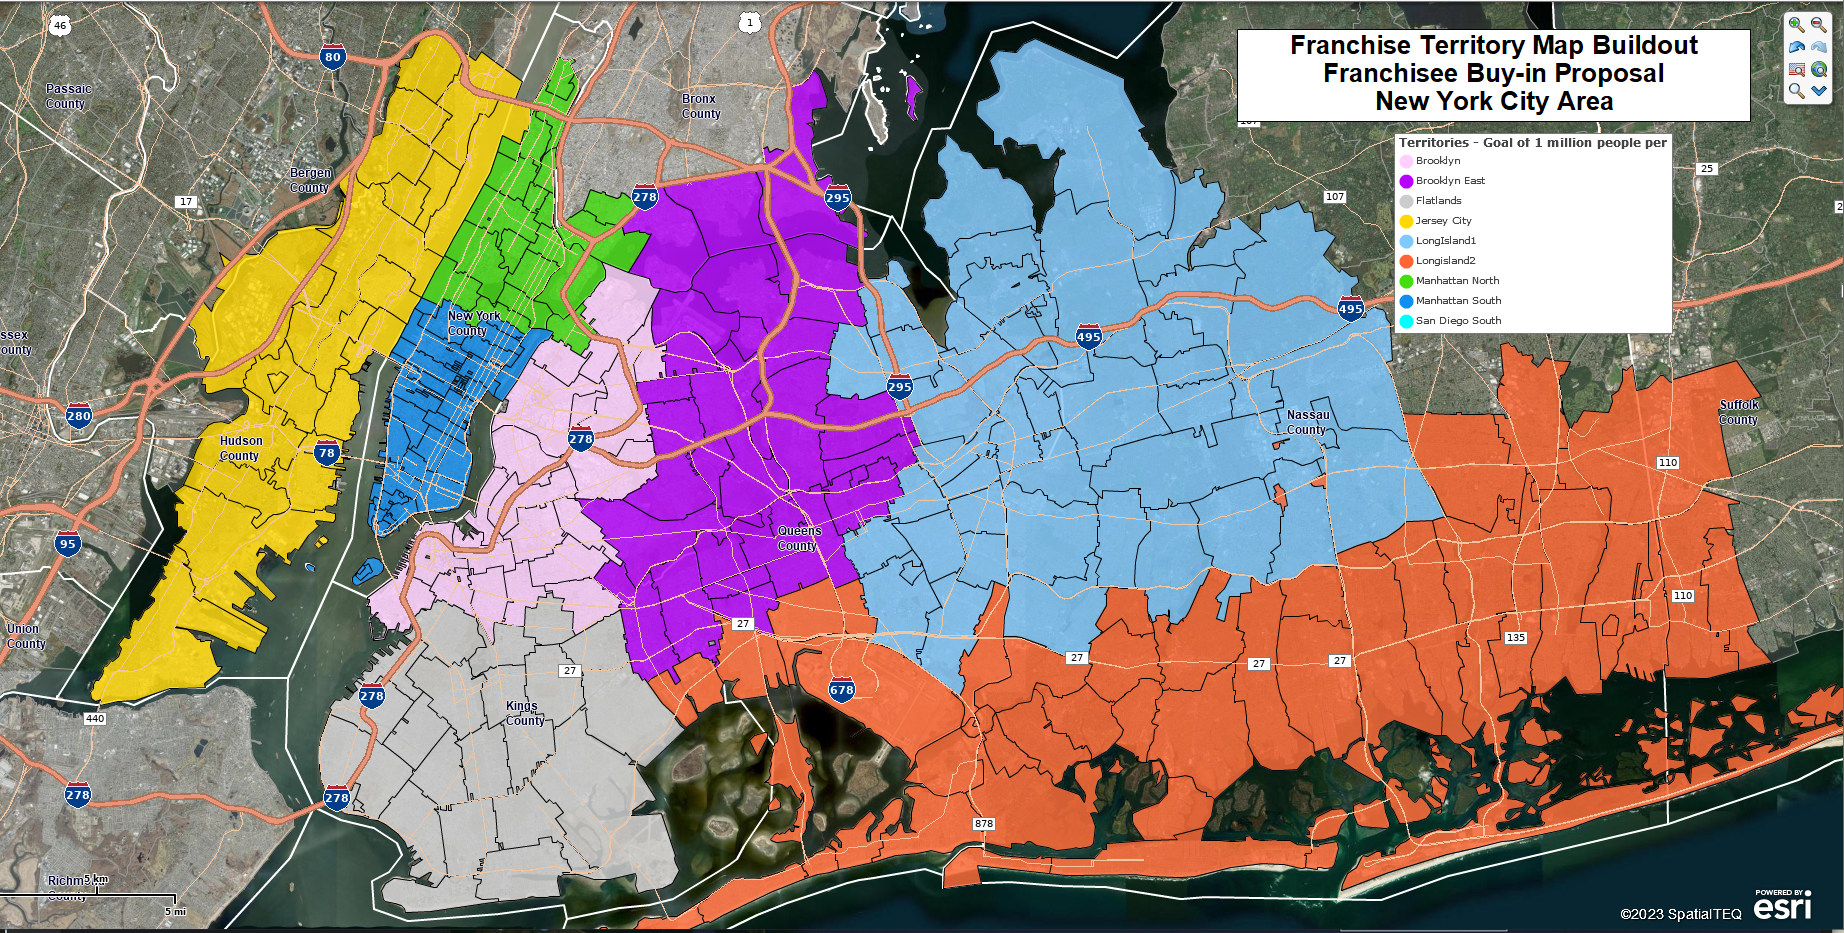
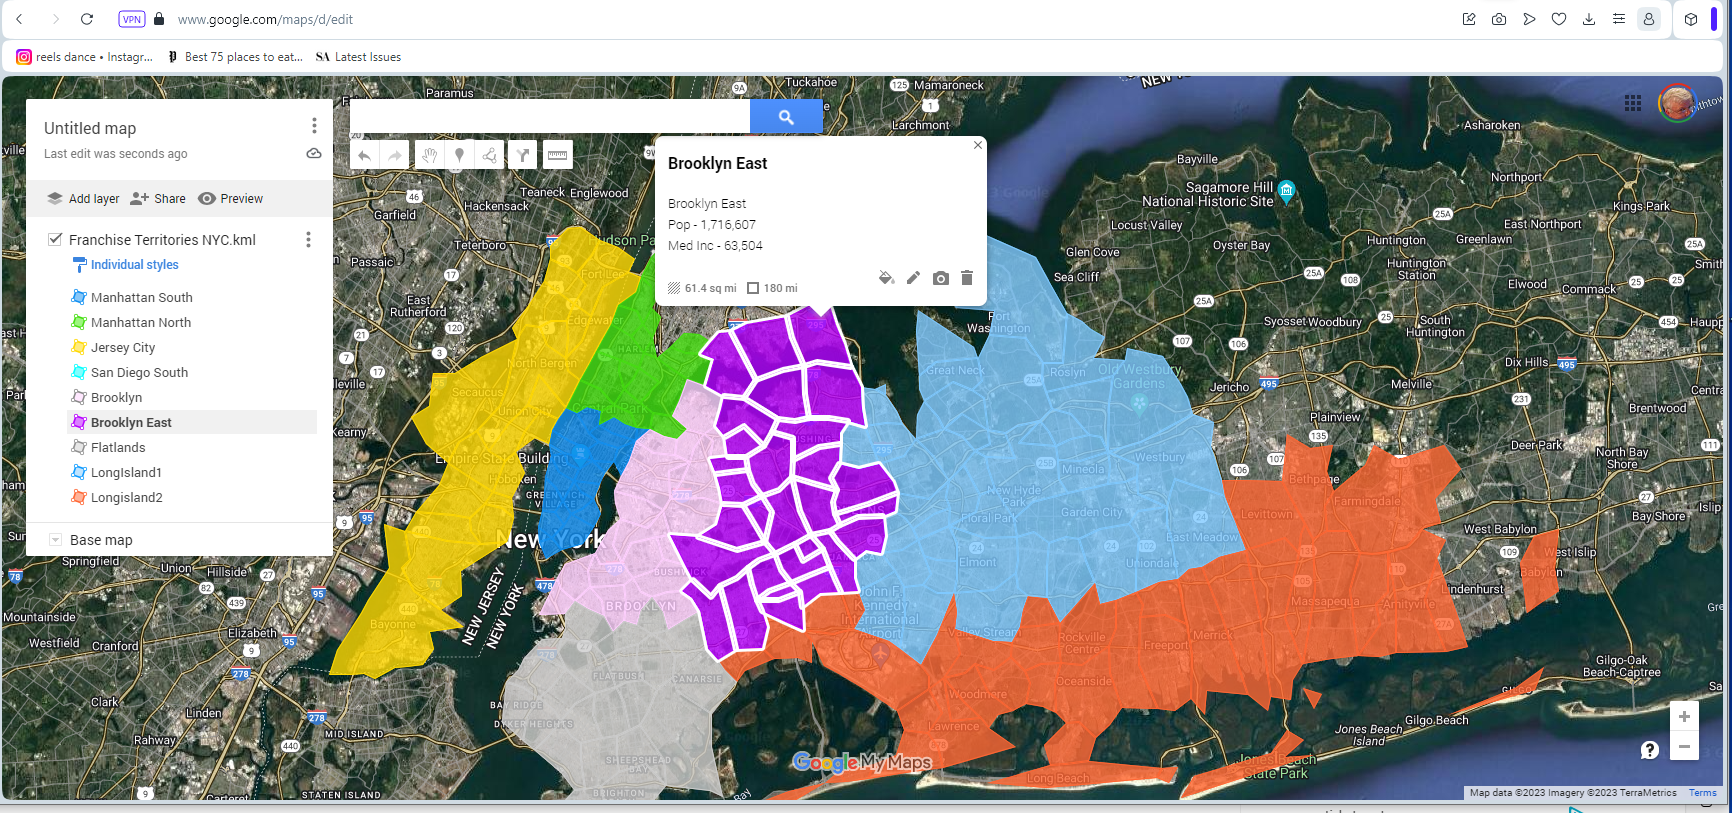
Franchise businesses love territory maps because map visualizations describe the franchisee’s territories well. Map visualizations created in MapBusinessOnline also include a data view.

What problems does MapBusinessOnline solve for a franchise business?

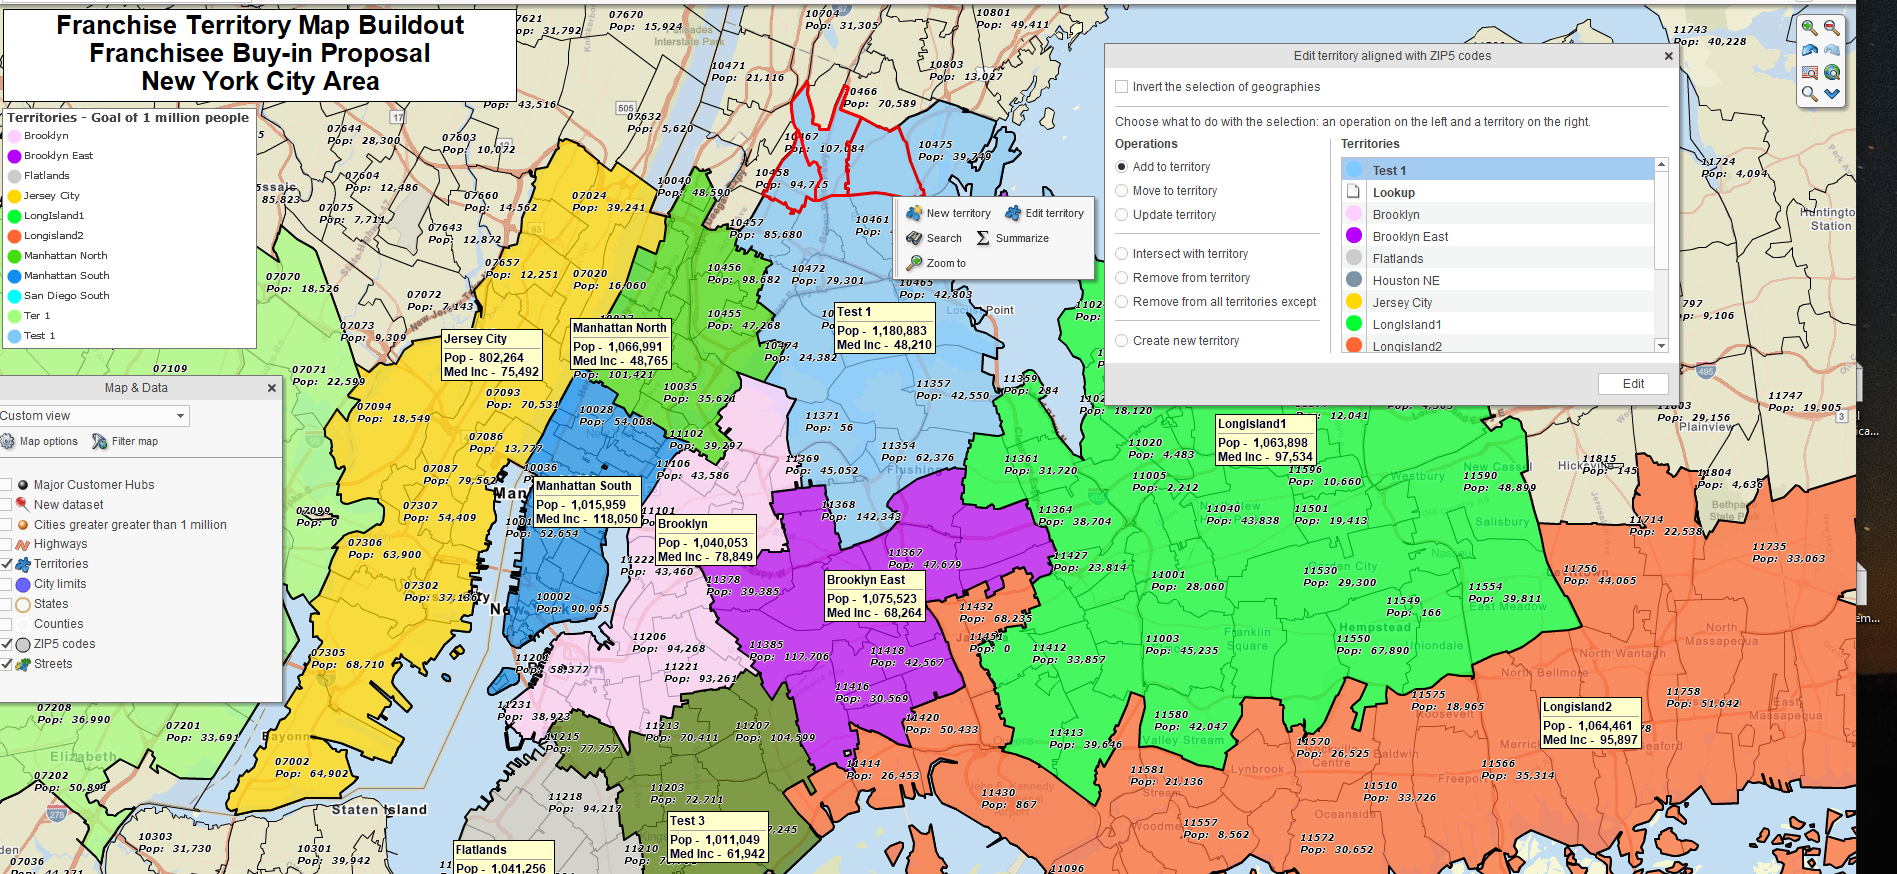
  1. Ensure the franchisor and the franchisee are clear on territory boundaries, with no overlap with other franchisee territories.
  2. Balance franchisee territories to keep things equal between franchisee businesses.
  3. Provide the franchisee with a map visualization of the territory to be filed with the franchise investment records.

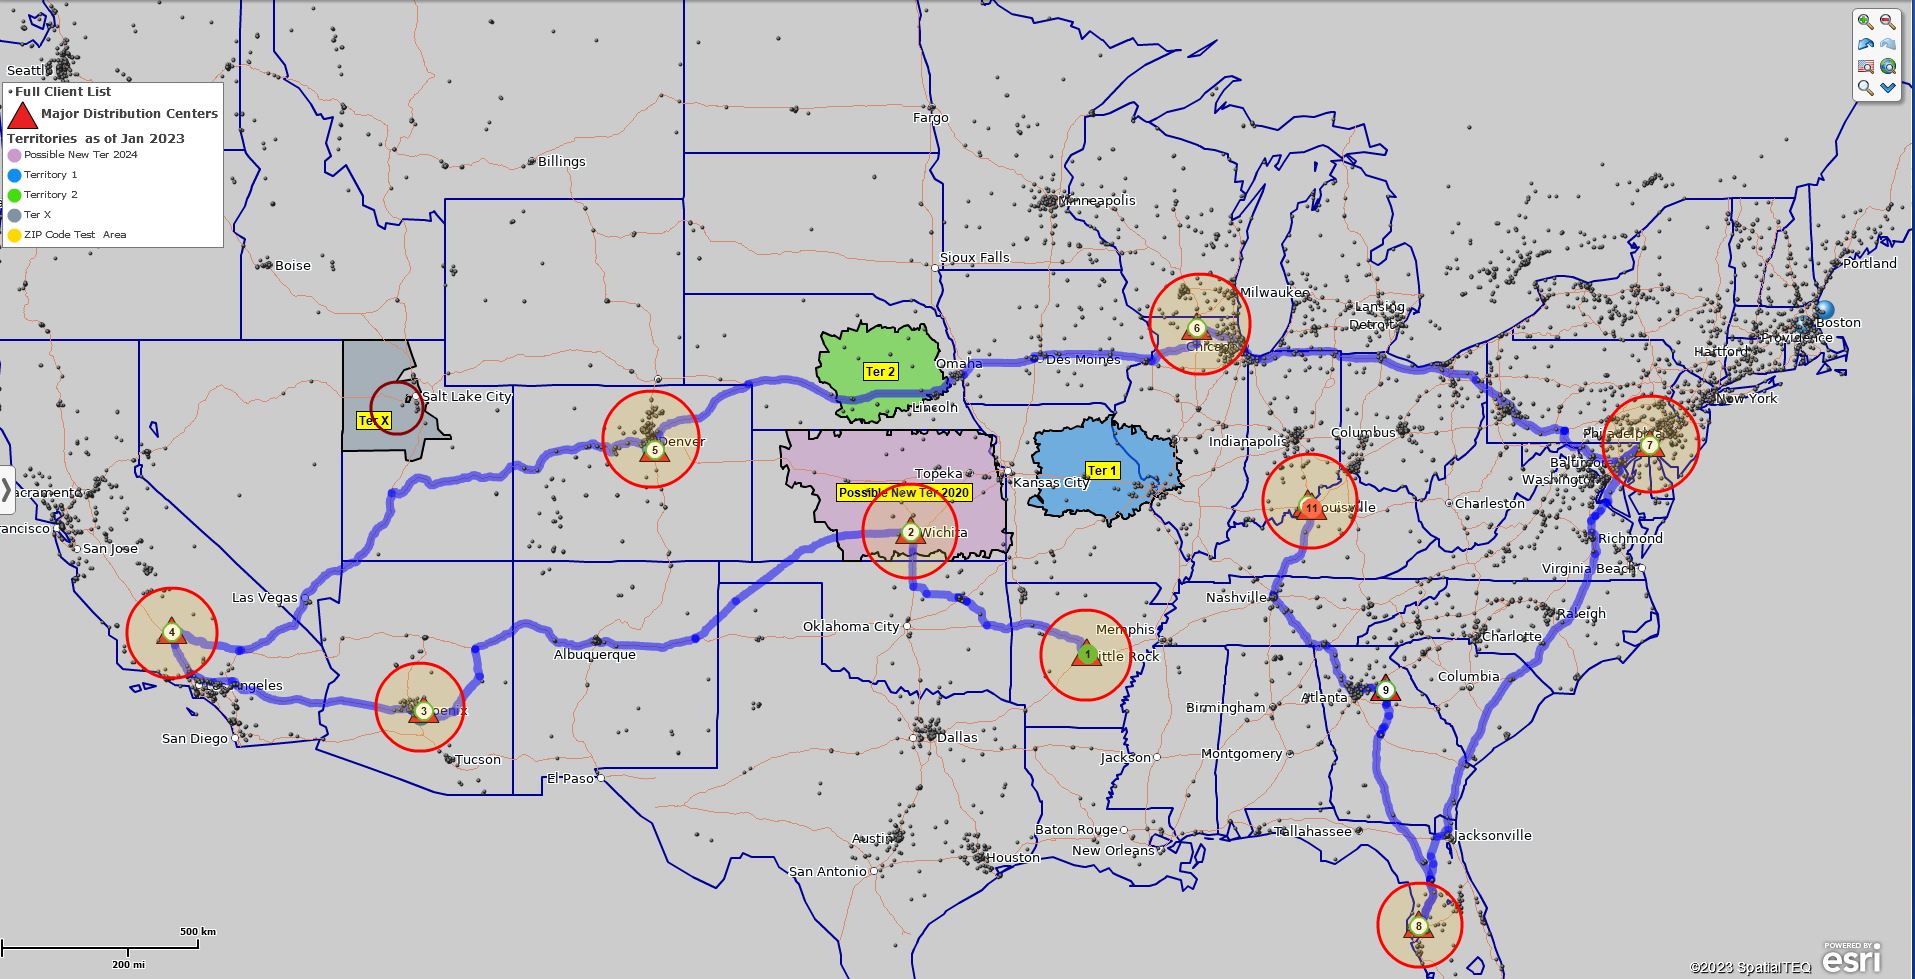
Franchising businesses use MapBusinessOnline to analyze the marketplace and balance territories.

Construction Industry Mapping

Business mapping software provides geographic visualization tools perfect for site management and assessment. Construction, property management, and real estate professionals use Map Business Online Pro for portfolio management and site assessment tasks.

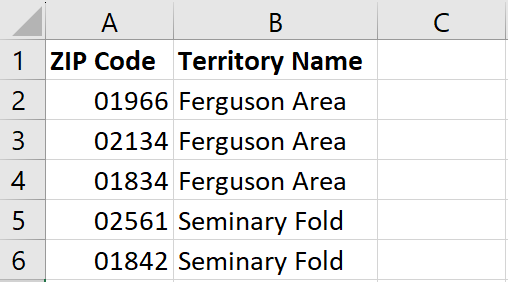
Portfolio management means specific sites or groups can be imported into a map project as a location dataset. Typical Excel or standard spreadsheets can be imported easily by address or lat/long coordinates.

Once imported, map visualizations are created from future site location data to enhance sales processes and construction management. For example, construction site locations can be visualized within a specific driving time or distance window of the nearest critical resources. Construction sites can be color-coded and symbolized to reflect project status and type, such as construction versus renovation sites.

What problems does MapBusinessOnline solve for a construction business?

  1. A map visualization shows where existing construction projects are located. Similar projects might fit well into the business growth plan, perhaps assisting sales with new leads.
  2. Site assessments can be organized by mapping projects, tracking inspection appointments, and other milestones, providing an organizing platform for project review.
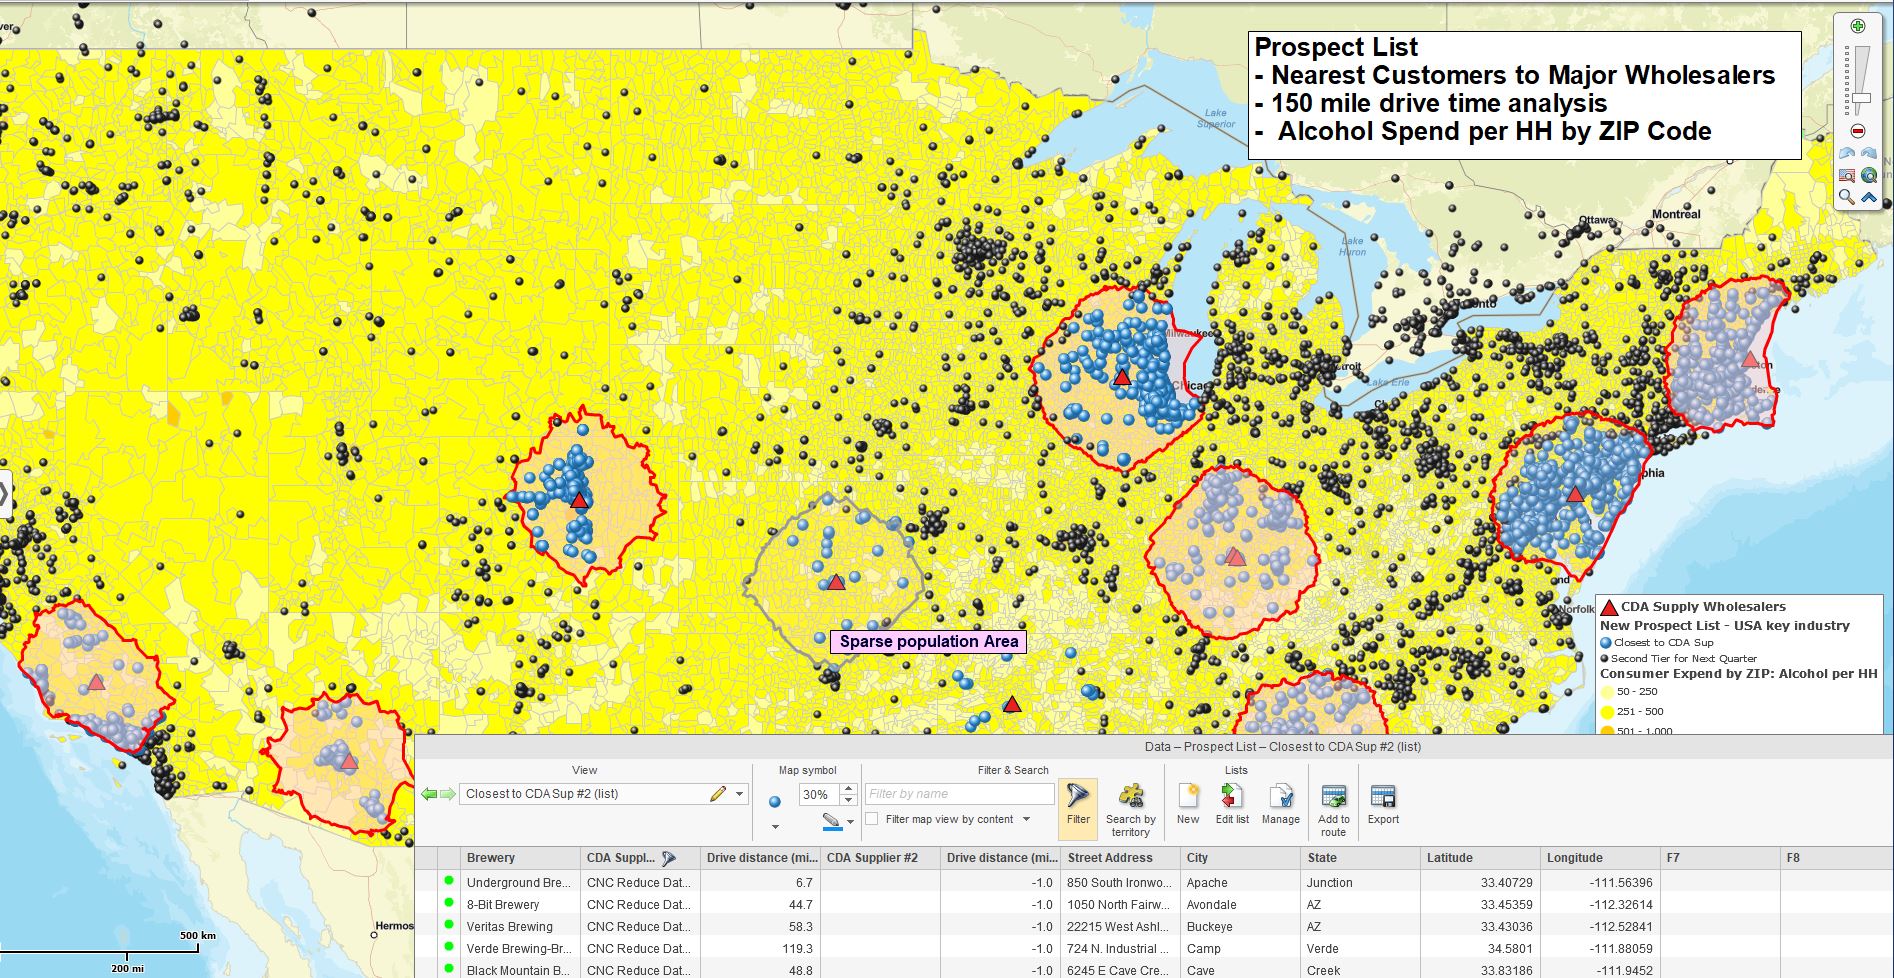
  3. Where are all my critical resources located? MapBusinessOnline Pro conducts proximity searches to reveal the nearest municipal, medical, and other industry resources.

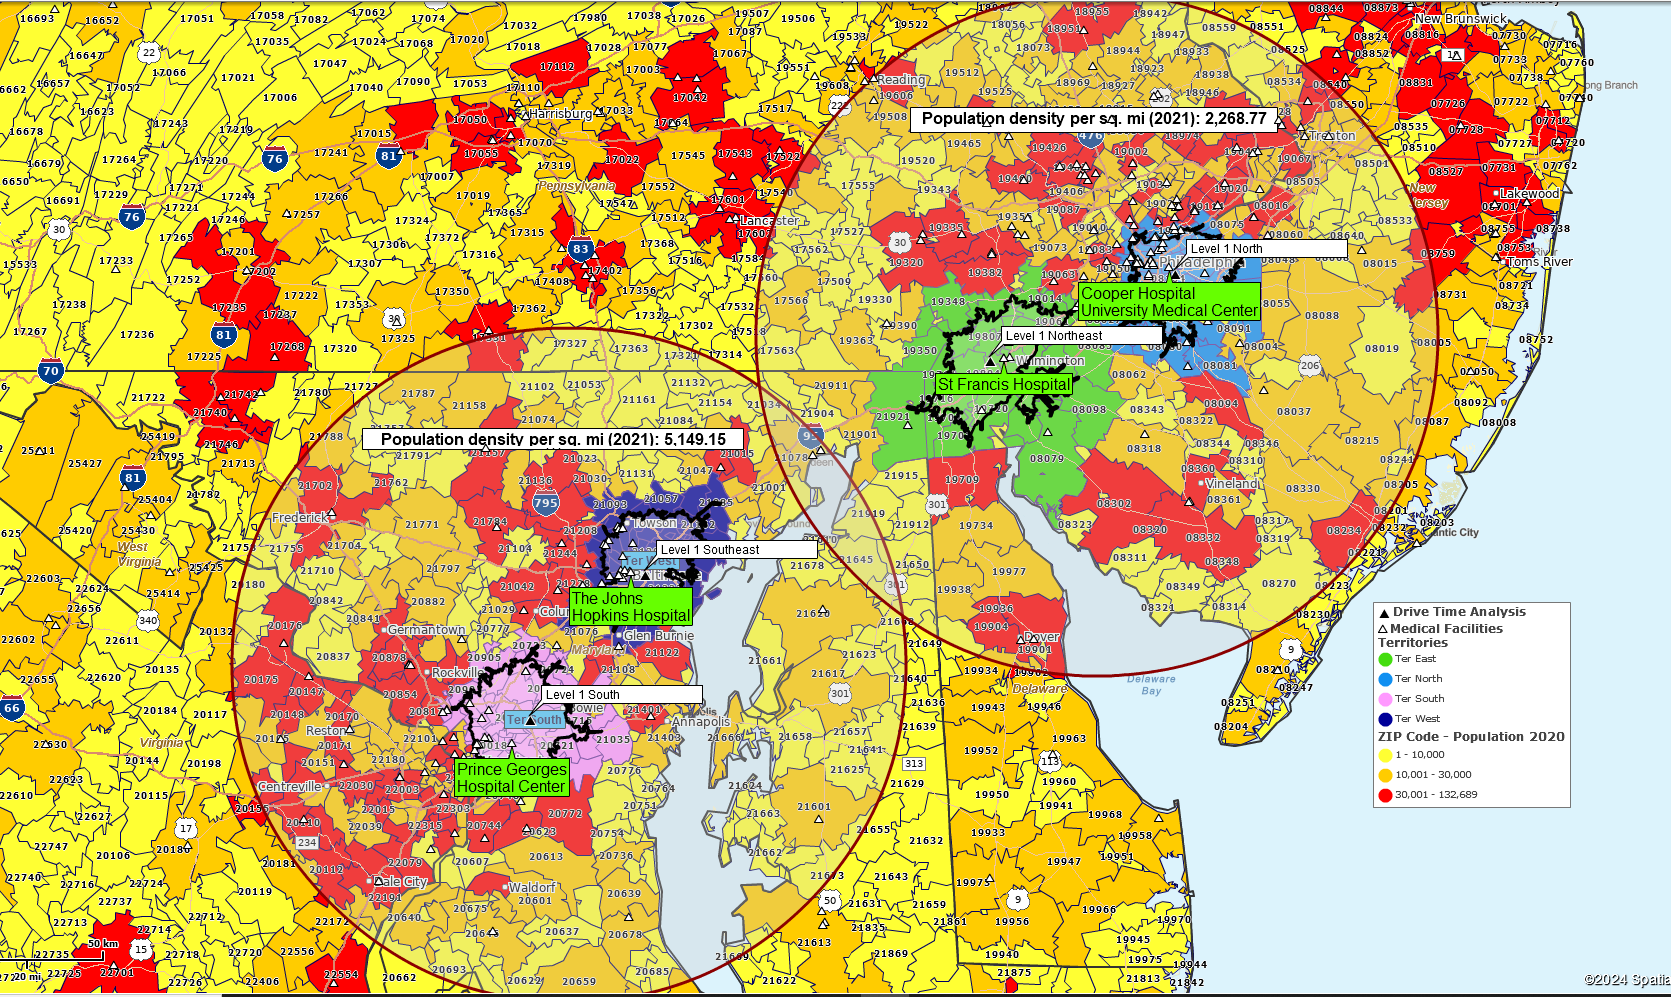
Medical Business Planning

Anyone seeking medical services in urban areas with at least one hospital system will have noticed medical businesses changing ownership or merging with new umbrella business management. Such medical system consolidation can bring challenging operational shifts impacting medical professionals and the patient community.

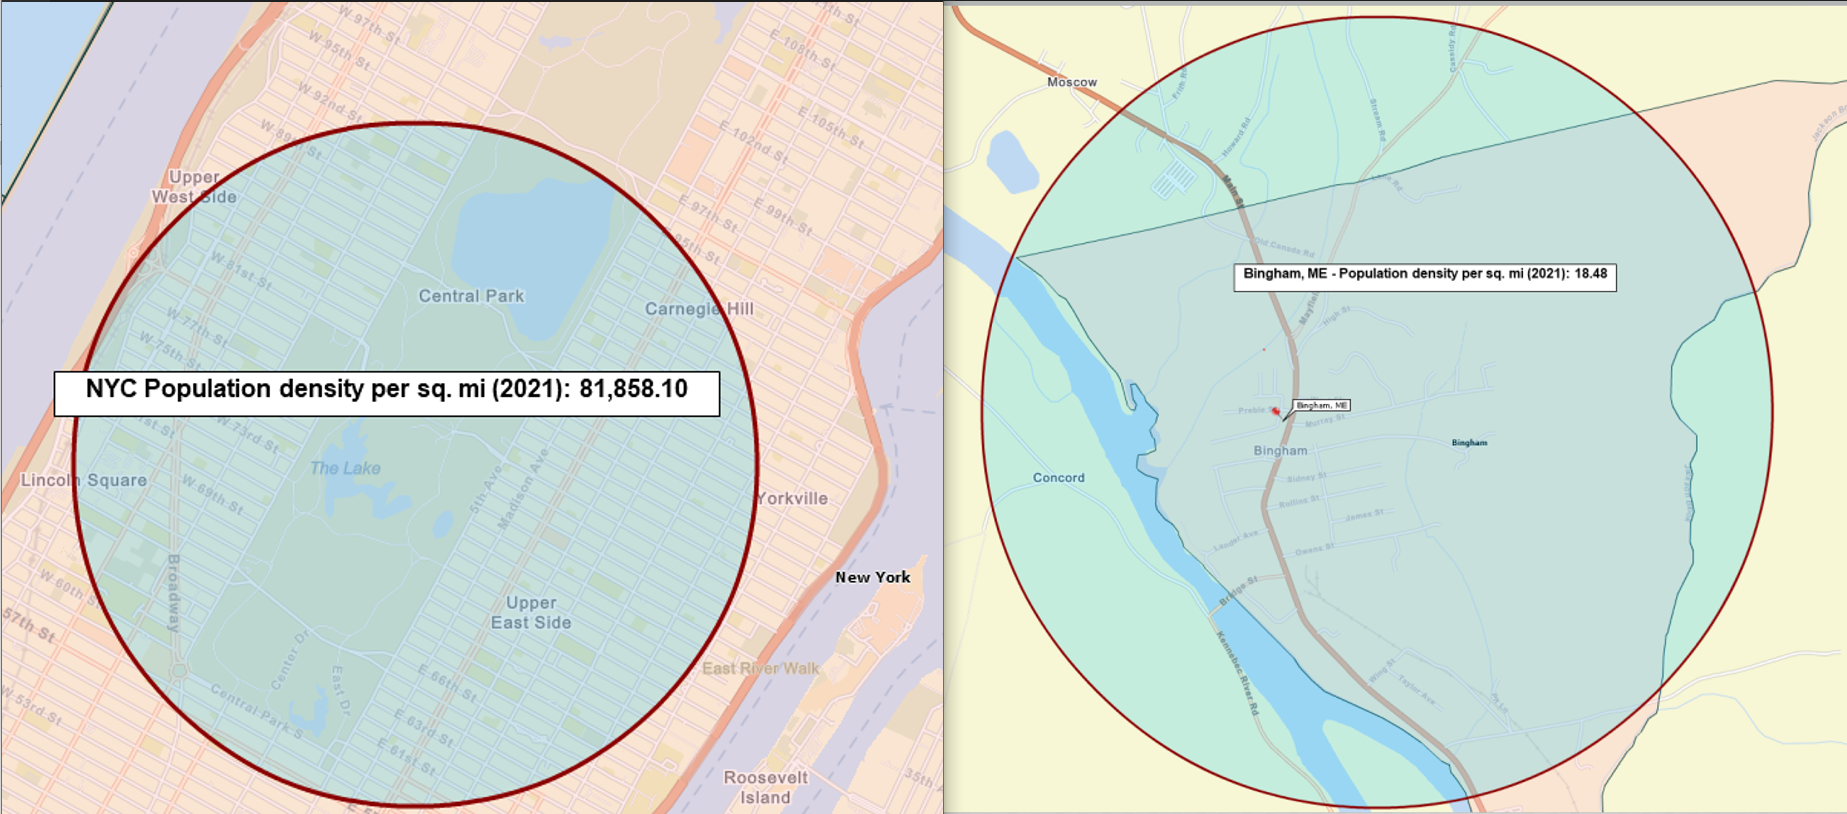
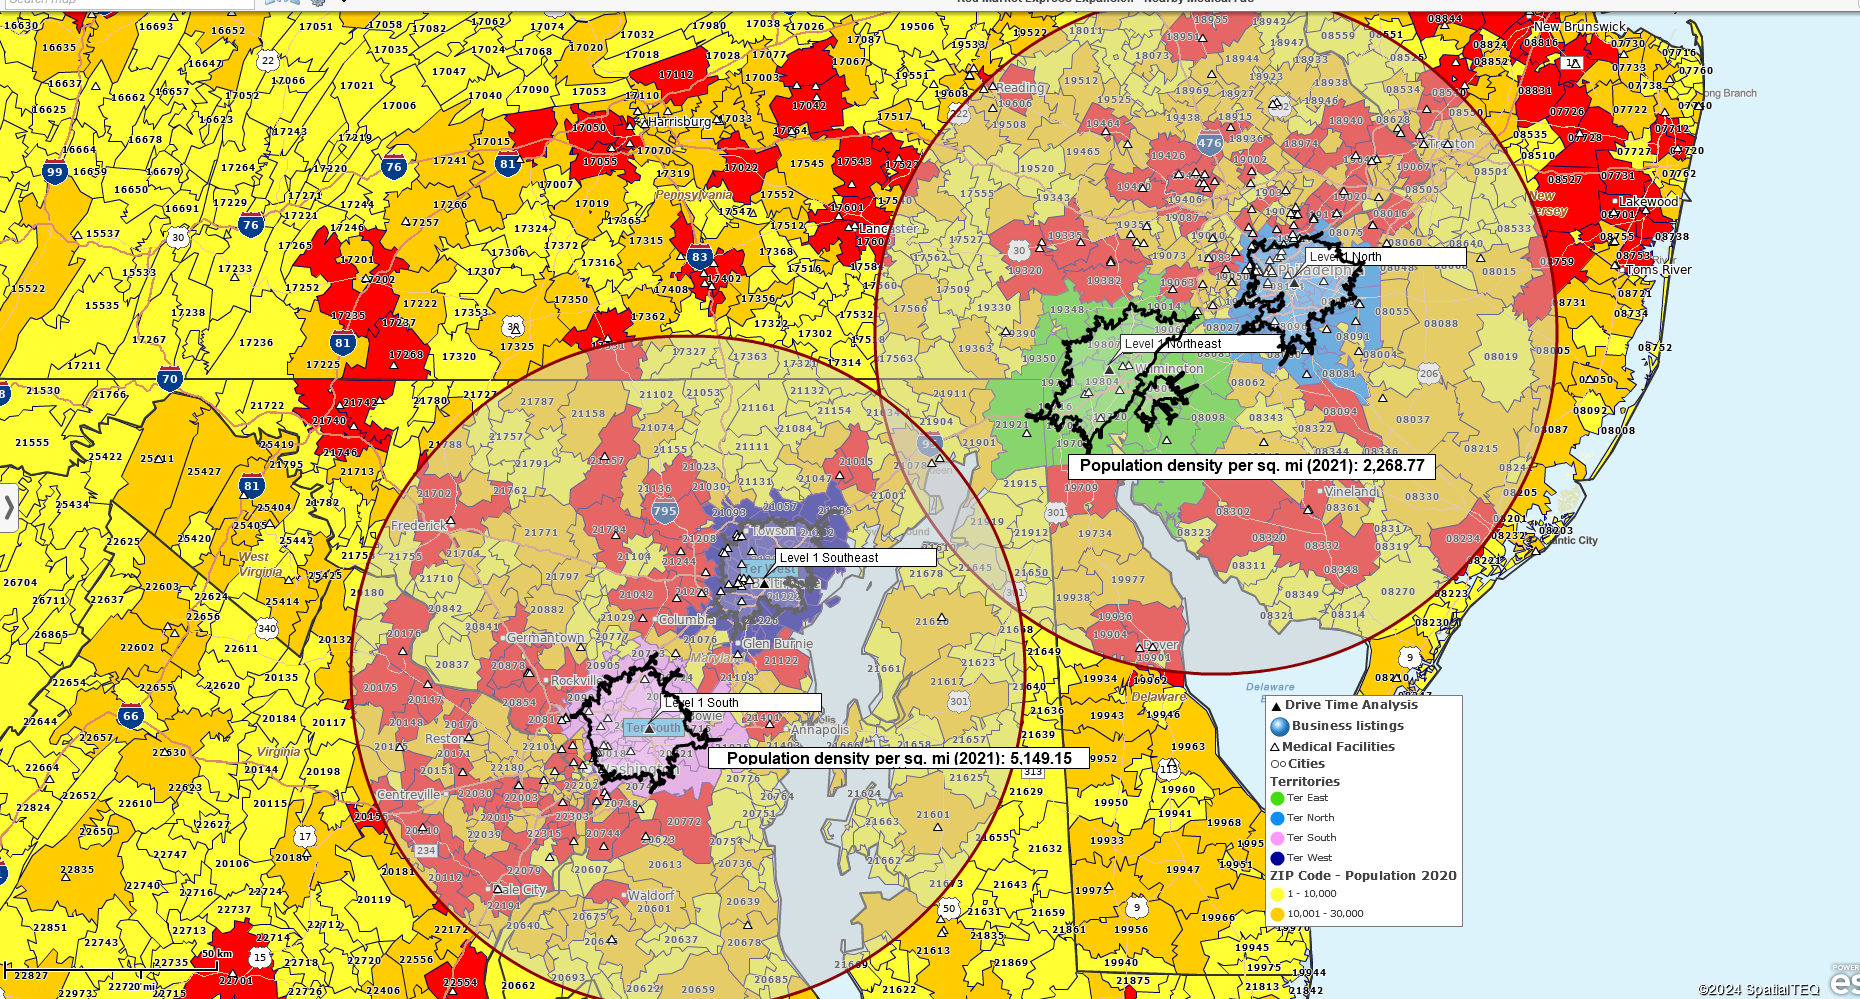
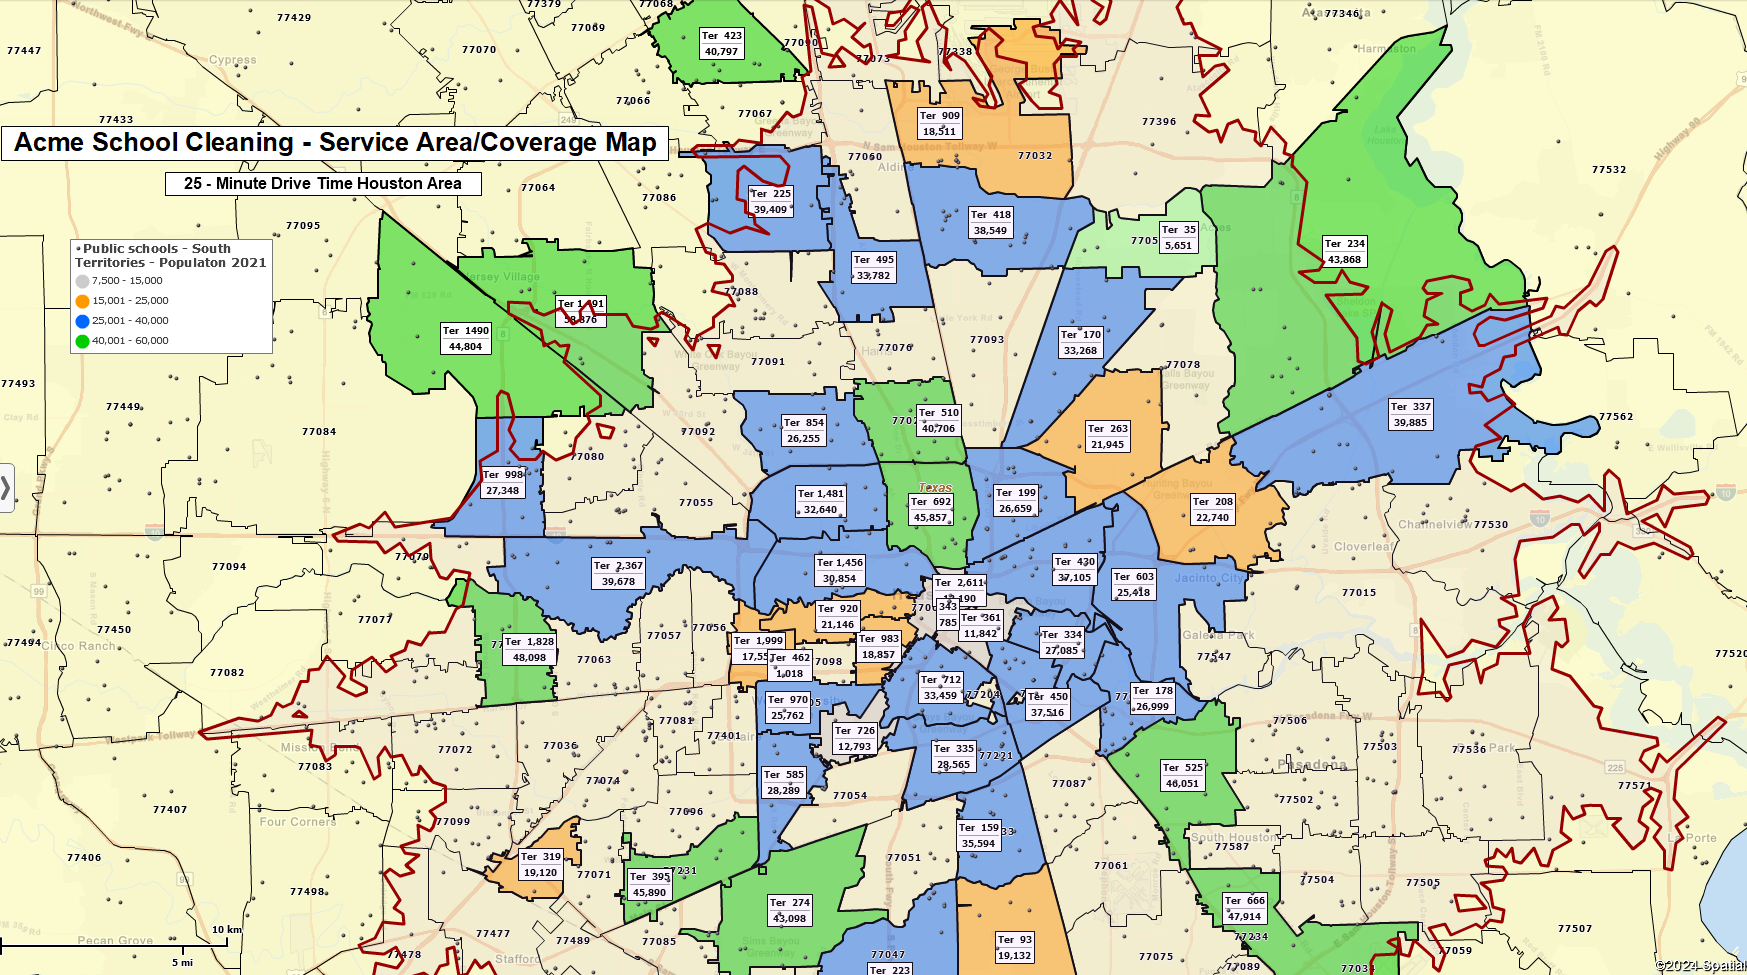
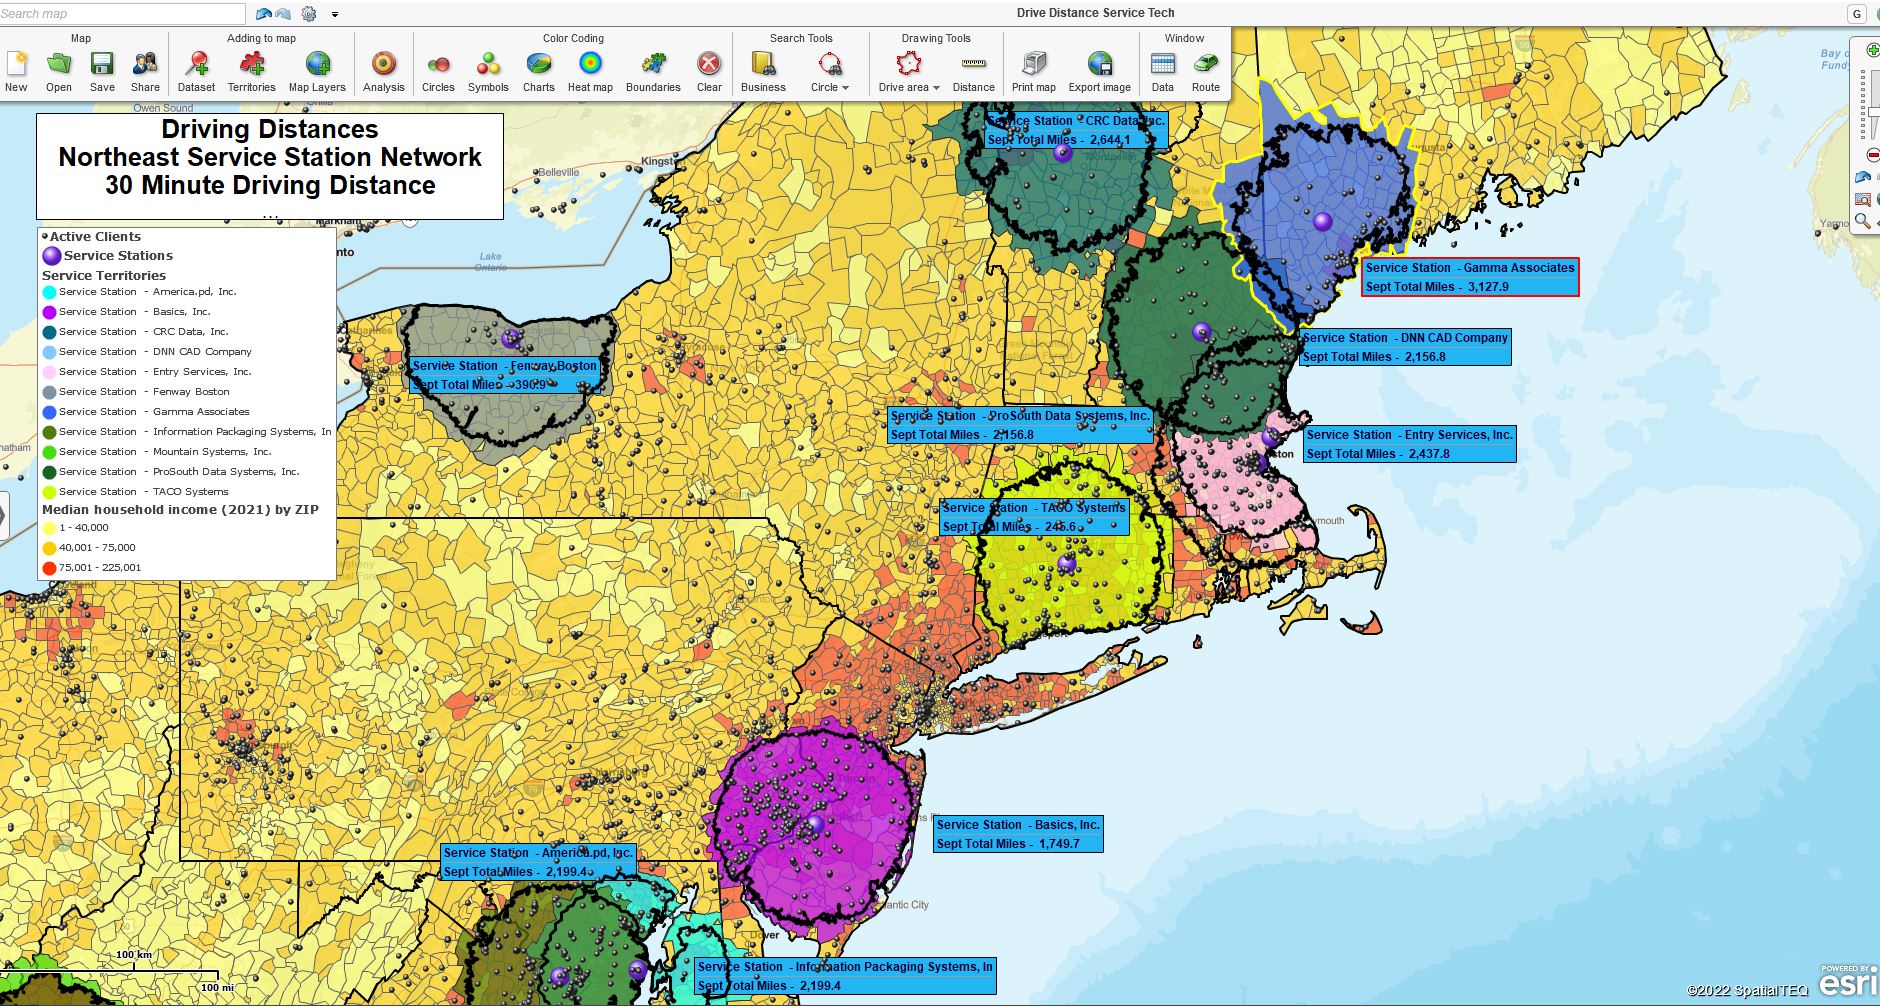
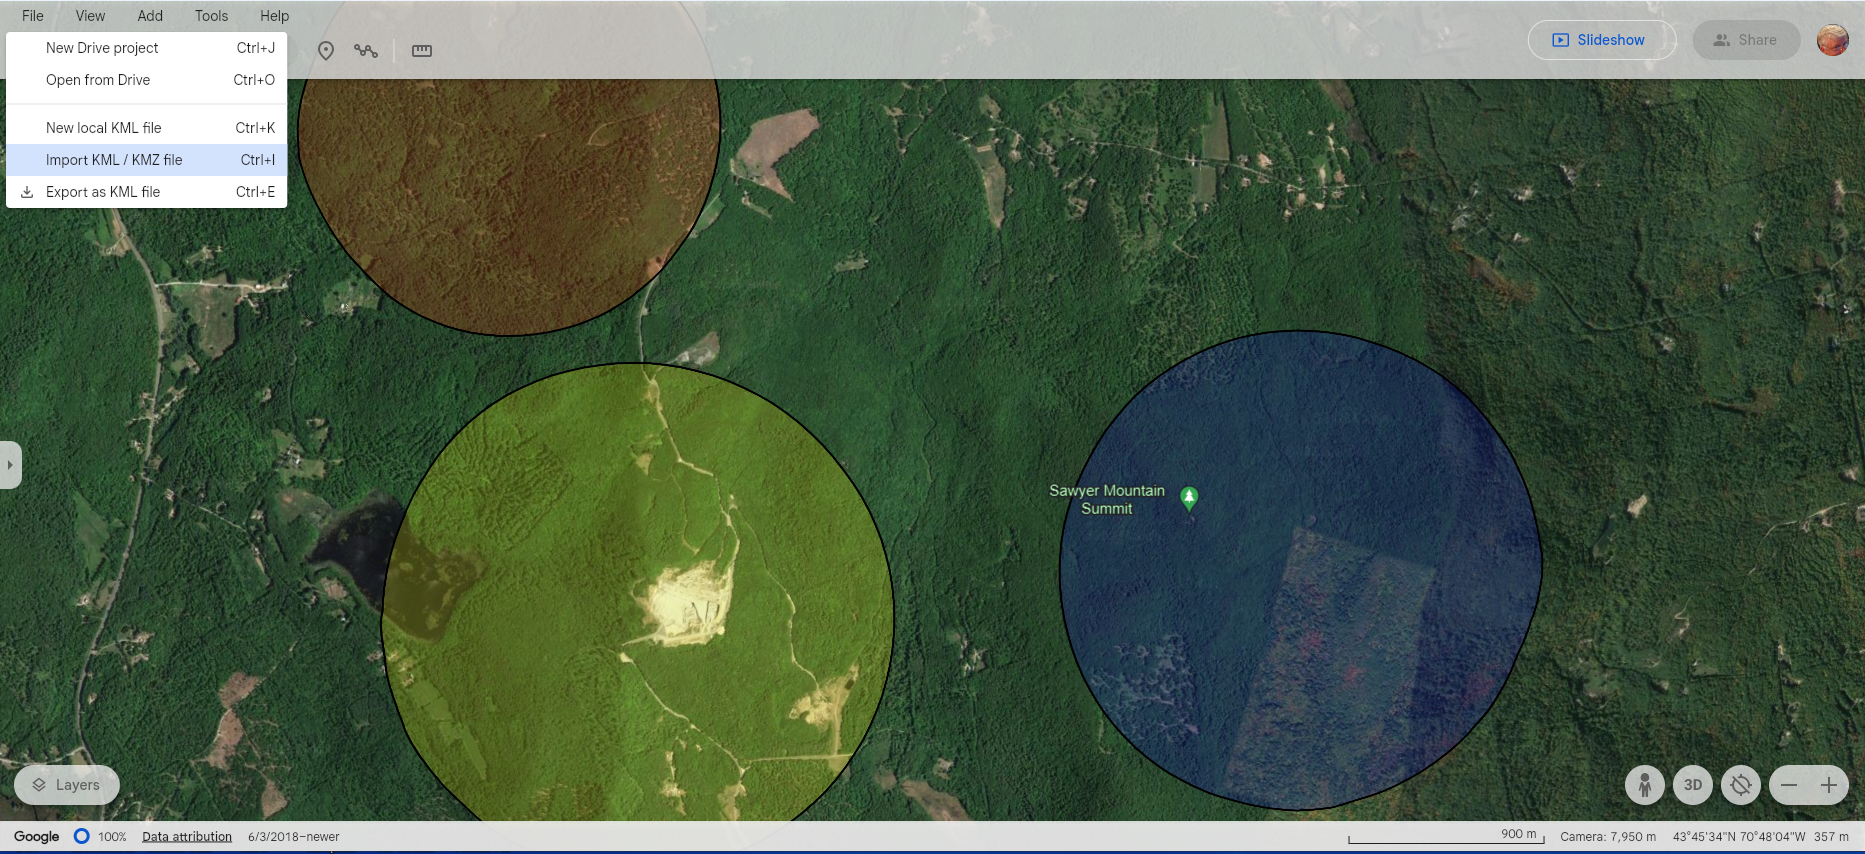
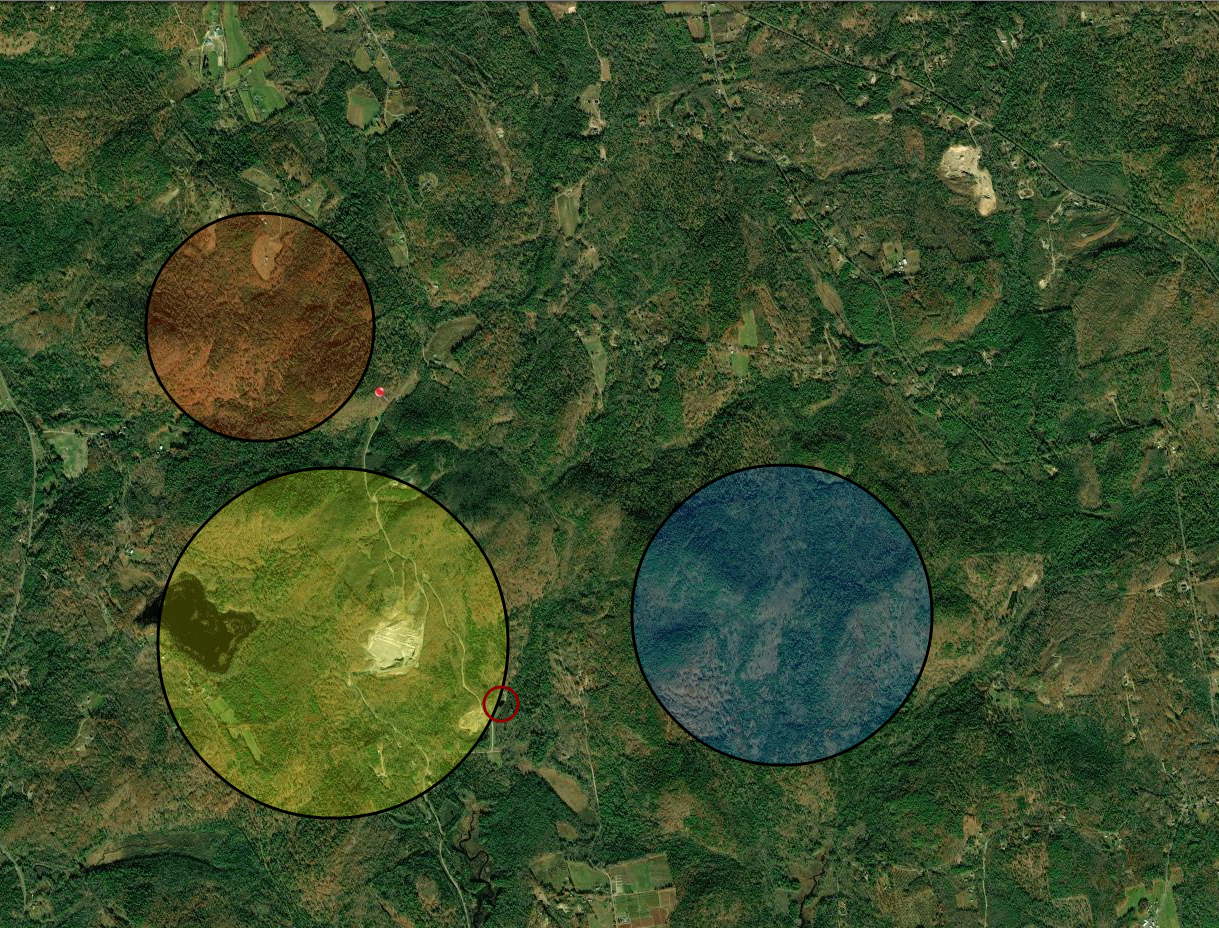
Medical system planners often include an analysis of driving time and distance analysis in their acquisition and systems development planning. MapBusinessOnline Pro provides affordable driving time and distance tools to quickly define areas of interest based on driving time measurements.

Health Care System analysis map using MapBusinessOnline.com

What problems does MapBusinessOnline solve for a medical systems business?

  1. Understanding where the core client constituency lives. Establishing driving time or distance tolerances for most patients seeking standard medical services means site assessments can proceed in designated areas. Driving time and distance queries can help decide where to locate a medical lab or imaging facility to maximize client convenience.
  2. Organizing medical business consolidations based on like services and proximity to the central hospital system. Maps keep things efficient.
  3. Understanding where traveling clinicians are today and viewing patient locations on a business map can help avoid expensive clinician travel cross-traffic while addressing critical patient needs.

MapBusinessOnline Pro provides significant businesses with the advanced capabilities to solve complex business problems based on location.

  • Import up to 250,000 locations points per map.
  • Create up to 1,500 territories per map.
  • Generate proximity searches, origin-destination analysis, and demographic analysis.

We help businesses with where, when, and how challenges.

Request a web demo here.

Posted in Business Mapping Software blog post, Franchise Mapping, How to instruction, Sales and marketing | Tagged , , , , , , , , , , | Leave a comment

Radius Searches Compared to Driving Time & Distance Searches in MapBusinessOnline

Radius and Driving Time searches are commonly used geospatial search approaches within MapBusinessOnline. Each data search tool has its advantages.

MapBusinessOnline Standard offers both Radius and Driving Time and Distance search options under Search Tools on the Master Toolbar.

MapBusinessOnline Pro includes all Standard capabilities and offers extended Radius and Drive Time mapping capabilities through the Analysis Button on the Master Toolbar.

Read more about the differences between MapBusinessOnline Standard and Pro.

Radius Search

Selecting the Circle or Radius option from the Search Tools drop-down generates a basic radius search. Place a center point on the desired location, and select the circle’s radius distance by dragging your mouse cursor or adjusting the radius length in the Properties dialogue box that pops up.

Select the Radius option from the Search Tools and choose your search radius.

But why generate a radius search to begin with?

A circular area or radius spatial search is an organized way to view data. An organized search can help locate a dead body, a lost child, or a missing wedding ring. Radius searches also reveal trends in data, such as customer purchase patterns or disease trends in the field.

Radius searches are more straightforward than a driving time or distance-based search. A circular shape or radius object is placed on the map, and the area it covers is searched for data. A driving time or distance polygon must also account for the travel along the road network. The resultant shape of the area is based on the calculation of driving time or distance. This means we must consider distance traveled along all roads, speed limits across all roads, and even turn restrictions across all roads in all directions.

Radius searches can be easily duplicated on a map view. A map creator can copy the radius search and plot the same search at a new location. Concentric ring searches provide extended radius searches – first a 1-mile search, then a 5-mile search, and so on.

Radius searches are also faster than polygon and free-form searches. The map creator doesn’t have to be so exact. Drop a point, stretch the circle to the desired size, and go. Polygons and random shapes can be messy, unintentionally grabbing areas and data outside the intended space.

Data searches are similar to physical searches. Radius searches in standard lengths keep things consistent across a map. Of course, there may be times when a varying search radius is applied. A polygon search tool might work better around significant geographic obstacles. It depends on the circumstances. For instance, mountains and highways can complicate real or virtual searches for things or data.

A consistent radius search area can provide relevant results when analyzing or comparing demographic data. A five-mile radius search in New York City will display very different results from a five-mile radius search in Bingham, ME, which is how it should be—a reflection of population density. In the case of New York City versus Bingham, ME, the population density is staggering different based on a consistent 1-mile radius.

New York, NY vs. Bingham, ME.

New York, NY – 1-Mile Radius Search Population Density – 81,858.1

Bingham, ME – 1-Mile Radius Search Population Density – 18.48

Calculated using MapBusinessOnline Standard Radius Search and US Census Bureau Demographic Data.

Drive Time Searches

In MapBusinessOnline Standard and Pro, Drive-Time searches, as mentioned above, are a more complex alternative to Radius Searches. The user still searches an area for imported location, demographic, or geographic data within a defined area. But instead of a circular area, a drive-time area is generally a jagged polygon that reflects the area encompassed by a vehicle’s potential travel perimeter in all directions over a given time.

Drive time configurations consider road speed limits, one-way/two-way restrictions, highway classifications, and time of day traffic. So, where a radius search defines a 5-mile circular area, a driving distance search shows the map view of the area covered if a vehicle traveled five miles along the road network in all directions. Likewise, a driving time search shows the area covered if a car traveled along the road network for five minutes in all directions.

Drive time polygons used for territory development.

Driving time search results gather data within a driving time or distance polygon. These dataset query results in MapBusinessOnline could report imported demographic and geographic data.

Retailers like drive-time searches for defining and analyzing marketing campaigns. Driving times help define core audiences for campaign messaging, for example, the assumption that a family won’t drive further than a 20-minute drive time for pizza or miniature golf.

A manufacturing sales team might use drive time analysis to define territory areas based on the sales representative’s start-of-day locations and maximum driving distance. This is a common method for balancing territories and keeping workloads and compensation fair.

Logistics managers use driving time and distance searches to determine optimum travel pathways for supply chain transportation networks.

Facility operations planners use driving time searches to calculate the most effective new locations for warehousing, stores, or light manufacturing facilities.

MapBusinessOnline Pro enhances the drive time search capability of MapBusinessOnline Standard by offering multiple center point searches, origin-destination batch analysis, and comparison of multiple datasets for driving time and distance results.

In many mapping situations, both radius searches and driving time and distance searches can be used on the same map. Drive time polygons might be used to create territories or areas of interest related to a highway. A general radius search could provide relevant demographic data for the map viewer on the same map.

A site selection planning map with relevant demographic data highlighted by a radius search.

As always, business mapping tools serve your map’s business purpose. Use them wisely and avoid superfluous clutter on your map, or you might win the National Map Geek Cluttered Map award.

Request a web demo here.

Posted in Business Mapping Software blog post, Franchise Mapping, How to instruction, Sales and marketing | Tagged , , , , , , | Leave a comment

Find the Nearest Facility – Retail Expansion with MapBusinessOnline Pro

Here’s an anonymous story:

We’d been working on our current variety store expansion project for months. As Organization Expansion Director, my job was to facilitate expansion plans responsibly. The business’s overall growth plan focused on launching four or five new stores yearly until Red Market Express Variety stores covered the entire nation’s major highways with minimal territory overlap.

The challenge was to sustain this growth pace through all economic climates, meet revenue and profitability goals, and always comply with national, state, and local laws and regulations.

One of the beneficial tools we used to achieve our aggressive company goals was MapBusinessOnline.com business mapping software. We used MapBusinessOnline Standard to set up territories by store. After a while, our store roster expanded considerably, so we upgraded to MapBusinessOnline Pro. Upgrades are prorated to protect user investment. Just click Subscribe on the website or in the Account section of the application.

If you’re managing just a few locations or creating less than fifty territories per map, MapBusinessOnline Standard will do fine. But as you expand, you should upgrade to MapBusinessOnline Pro for more advanced location-based analysis tools:

Radius-based territory mapping used for expansion planning.

MapBusinessOnline Pro Strengths

In some cases, individual Red Market Express stores conducted some prospecting campaigns within reasonable drivetimes of their stores. They used MapBusinessOnline Pro to define a given store’s driving time audience. Typically, these local target markets were people who lived or worked within a 20-minute drive time of Red Express stores. Population density was a factor. We’ve found that areas with a population density of at least 5,000 people per square mile were more responsive to enticement campaigns offering discounts for certain items, including Slurpies, Milk Duds, cartons of cigarettes, and Tylenol.

MapBusinessOnline Pro enhances general business intelligence with location-based intelligence. The tool can identify the nearest resources, expose demographic characteristics by area, or present all travel times and distances between all points across two datasets. There is power and intelligence in location-based analysis. MapBusinessOnline Pro gives you all of that – affordably.

Four drive time zones surrounding the proposed new retail store locations.

Finding the Nearest

For this year’s store expansion project, we’re focusing on the East Coast I-95 corridor between Washington, D.C., and Philadelphia.

We determined the four optimum new store locations by analyzing the driving times and distances between Red Express’s existing stores, competitor stores, and regular gas stations. Acquisitions got to work on competing store buyout possibilities while a team of directors focused on buying real estate property along the highway. Prospective store surveyors are on the job as I write this, taking measurements and checking on local and highway restrictions. It’s a long process, but we’re used to the bureaucracy.

Let’s examine nearby medical facilities as a simple example of how MapBusinessOnline Pro can streamline the required analysis.

Four retail location territories with demographic information added by radius area.

State and federal regulations require highway retailers to have an emergency medical plan in case of a store or passing traffic emergency. Each store is required to have the best first aid kits on hand. Epy Pens, Narcan, and other emergency medicines are also required, as is training on how to apply such meds when warranted.

However, in most such emergencies, after treatment in the field, the nearest emergency medical center needs to be contacted for ambulance dispatch or to accept incoming victims, as the case may be. MapBusinessOnline provides a Business Listings search tool that enables the identification of all medical facilities and hospital ER locations with contact information.

Downloaded business listings are imported into the map view and assigned symbols on the map itself. MapBusinessOnline Pro offers further analysis, which can compare store locations with emergency services locations to determine the nearest emergency room.

Armed with this critical data, we post maps and contact information at each store location. We also train store employees to check shared map views for more hospital details as necessary.

Four retail expansion targets with the nearest medical facilities highlighted in the map view.

Finding the Nearest facility is just one of the MapBusinessOnline map analysis tools that leverage driving time and distance queries to provide relevant information for business success.

While MapBusinessOnline Standard provides:

  • Drive time polygons that describe an area by driving time and distances.
  • Territory creation for up to 50 territories per map.

MapBusinessOnline Pro offers:

  • All the features of MapBusinessOnline Standard.
  • Mass, multi-point analysis of driving times and distances.
  • Multiple territory creation simultaneously.
  • Territory creation for up to 1,500 territories per map.
  • Generate find the nearest proximity searches.
  • Import up to 250,000 location records per map.
  • Append imported datasets with demographic and geographic data.

Best of all, MapBusinessOnline mapping tools make you look like a mapping savant. Red Market Express thinks so, anyway.

Request a personal web demo here.

Posted in Business Mapping Software blog post, Franchise Mapping, How to instruction, Sales and marketing | Tagged , , , , , , , , , | Leave a comment

Balancing Territories Using MapBusinessOnline

Territory mapping software provides map visualizations and datasheet views of territories or areas of operation for sales and service businesses. Balancing those territories can be critical to the business model’s success for many sales, service, and especially franchise businesses.

What are Balanced Territories?

Territories define areas of accountability for sales and service associates. They visually represent geographic areas of responsibility for calling on or interacting with business accounts.

Business managers often seek to balance their territory assignments across the organization to preserve fairness in compensation, workload, and customer service levels.

A service territory map is created using MapBusinessOnline.

Territory balance can be achieved by roughly doling out equal amounts of balance factors such as clients, appointments, demographic assignments, miles traveled, monthly sales goals, and even compensation payouts. Businesses could also combine multiple balancing factors as a formula for territory balancing. For instance, use MapBusinessOnline’s Calculated Data Columns to create a ratio of client customer counts or total sales values divided by the total population for a given area.

We advise most clients to keep balancing simple so that sales and service associates understand results measurements. Motivated sales and service people love to calculate their payout. Franchisees will also be very concerned about how their results are calculated. Keeping it simple ensures that the individuals involved easily understand their measurements and are treated fairly.

Select Your Balancing Factor

Business mapping software provides territory tools that create a balanced workload. MapBusinessOnline includes a simple database management tool called Choose Columns so that each territory map also includes a territory analysis view, like a spreadsheet within a territory system. Choose Columns is located in the lower right of the Data Window view. Read more about Choose Columns.

A territory analysis view in the Data window can display one, two, or three numeric columns for balancing territories. You could import many more. These territory balancing factor columns could be sourced from MapBusinessOnline demographic data or imported client business data from a spreadsheet. Relevant datasets could include but are not limited to:

  • The sum of accounts by territory – derived by summing counts by ZIP code, County, state, or city limit.
  • The sum of historical sales by territory – derived by summing counts by ZIP code, County, state, or city limit.
  • The sum of demographic populations by territory.
  • The sum of median household income by territory.
  • The sum of consumer expenditures by territory.

MapBusinessOnline enables a drill-down analysis view for each territory in the Data Window. A total button is available at the base of each territory view. This allows a map creator to see subject totals for each territory balancing factor and to consider how well-balanced or equal the territories are.

For example, based on experience and compensation requirements, a business has historical sales volumes across most territories, reaching close to $250,000 per quarter. Map editors can adjust territory size to roughly balance territory totals and keep compensation fair across the company or department.

In other words, adding or removing ZIP codes from a territory can make it more or less balanced overall.

Because ZIP codes, sales histories, and demographic data are highly variable, balancing will never be a perfect number. The goal should be to get the various sections roughly equal to balance workloads and compensation, keeping the team happy and performing well.

Your map creator must select a territory-balancing factor that makes sense for your business. Each business has its key metrics – population, sales dollars per quarter, median income per area, and driving distance miles. You should know that metric; if you don’t, speak with your sales department.

Business factors often impede reasonable balancing. For instance, legacy accounts tend to weigh the compensation in favor of seasoned salespeople. This may be an advantage to your organization, motivating solid performances. There’s nothing wrong with favoring long-term field reps as long as it is above board. Avoid nepotism and favoritism in general, but seek to get maximum use out of the team you have.

Balancing Territories

Choose the sensible map alignment layer to support your territories. ZIP codes are popular. The county alignment layer comes in second. States are more difficult to balance due to size. We’ll use ZIP codes for this discussion.

MapBusinessOnline ZIP code, County, and other jurisdiction layers include five flexible fields for appending labels. These label add-ons show up beneath ZIP code numbers and County names.

Developing a  ZIP Code-based territory map showing the population in the ZIP Code label.

  1. Add the Territory-Balancing Factor to Your ZIP code or County Label

When balancing territories based on ZIP codes, the first step is to add the numeric balancing factor column to your territory map’s ZIP code label. For instance, if Demographic Data values for the population are to be used to balance a franchisee territory system, add the Population 2021 data to the ZIP code Auto Label option.

Go to Map and Data > ZIP 5 Code Layer > Edit Map Layer Properties > Labels > Auto Labels > Add Demographic Population data to the first (1) flexible label field.

With the population data added to the ZIP code label, the map view suggests which groups of ZIP codes can be used to balance a territory segment. Create several territories to begin with. Start with territories that are well understood and performing well. Worry less about collecting every ZIP code and more about optimizing your territory size and accommodating traveling rep realities.

Now assign the same demographic balancing factor to the auto label for the Territory map layer in Map and Data. This will place the population totals for each territory in the territory label, making it easy to assess changes to territory adjustments. 

A franchise territory map with balancing factor sum in the territory label.

  1. Add Customer Location Records to the Map

Customer locations are helpful for territory balancing because they represent existing accounts that could be critical to sales coverage. Certain key accounts are often paired with Sales Associates for a reason – product experience, personal relationships, or proximity. Keep customer locations and customer assignments in mind while balancing territories.

Customer location data should also include a column for historical sales. This column could be used as a territory-balancing factor.

  1. Add the Territory-balancing Factor to the Data Window Territory view.
  • In the Data Window Territory view, click the Choose Columns button in the lower right.
  • Select your Territory-balancing Factor column in the Database Manager on the left side. (Population, sales history, or another relevant numeric data column)
  • Move the factor data to the right side.
  • Select Choose Columns in the lower right.

Now, all of your territories, using the ZIP code map layer base, have the same Territory-balancing factor assigned.

Using Choose Columns to Balance ZIP Code Territories by Population.

View the Map for Territory Balance considerations:

  • Decide if population totals by ZIP code will support building up territories to achieve balance. Look for city areas with significant populations that can be grouped for balance. Import traveling technician home locations and keep them in mind so that no one has to go too far afield.
  • Look for unassigned cities within a reasonable distance to accommodate any short territories. Remember, any additions to agent coverage areas must be physically achievable to count for balancing. Don’t give the guy in New England any Alaska ZIP codes.
  • Consider moving ZIP codes out of one territory and into another territory.

Edit Your Territory Assignments to Achieve Balance

Still using the Map view, select MapBusinessOnline Polygon or Freeform Search Tools to select multiple ZIP codes simultaneously:

  • On the Master Toolbar, under Search Tools, select the Polygon option.
  • Choose the ZIP code layer, click Next
  • Now pick a Create or Edit Territory option:
  • Add – Add your selection of ZIP codes to a specified territory.
  • Move – Remove your selection from one territory and place them in another.
  • Update – Change a selected territory to include only the selected ZIP codes.

You will primarily use the Add and Move editing options. The above instructions apply to the County, State, and City Limit map layer assignment territories.

Creating and editing territories for balance using MapBusinessOnline.

Redesign the Territory Structure

Sometimes, your existing territories may be too out of balance for an editing solution, so you should consider starting from scratch on a new map. For example, a medical home care business set up initial urban territories for four traveling clinicians. Later, they grew so fast they needed to set up territories for new agents. Because the surrounding ZIP codes were rural, there was not enough population in outlying areas to support full-time agents. At the same time, clinician coverage in existing territories was stretched to the breaking point. A rework of the entire territory system was necessary.

The above scenario can be tricky for Franchise territories, so please think ahead when creating territories and leave room for expansion where possible.

Meet with Impacted Associates

Meeting with the traveling or online associates who will deal with your territory creation is an excellent practice. Get their feedback. It could be critical to the territory balancing success. Associates who work with your territory maps will alert you to issues impacting efficiencies and customer requirements, such as:

  • Cross–traveling—Associates who travel and cross each other’s paths regularly drain travel budgets.
  • Overlapping territories – Overlap happens. Be aware of where overlap exists. Use MapBusinessOnline territory options to address it. Franchise organizations will want to use the overlap highlight tool to avoid creating overlapping areas.
  • Customer complaints – Listen to customer complaints about territory coverage. Ensure your territory structure enhances customer service. Nothing kills a good territory faster than unhappy clients.

Conclusion

Balancing territories is perhaps more art than science. I say this because there are many elements to consider besides a numeric balancing factor. Territory management must consider the many shades of gray impacting service coverage, including but not limited to the following:

  • Traveling agent experience with products and services.
  • Appointment setting, cancelations, and cancelation substitutions.
  • Rural vs. urban sales and travel patterns.
  • Type of business model. Distribution, Franchise, Government Sales, Inside Sales, Home Care Medical, Manufacturers’ Representative, Retail, Restaurant Chain, Service Tech, and Traveling Sales Team.
  • Product type. Office supplies vs. textile machinery.

MapBusinessOnline considers territory management a core feature and is always interested in how you use the product or how it could be improved. Contact us here and share what you know.

Posted in Business Mapping Software blog post, Franchise Mapping, How to instruction, Sales and marketing | Tagged , , , , , , , , | Leave a comment

MapBusinessOnline – Easy & Affordable Territory Management

MapBusinessOnline users invest in our business mapping platform for various reasons and to solve many use cases. However, territory mapping is a common application across almost all MapBusinessOnline clients, regardless of industry.

More advanced territory mapping can be applied to natural science studies or boundary studies using advanced digital mapping solutions. But MapBusinessOnline provides territory solutions for sales and marketing teams, service organizations, and franchising businesses. Our territory mapping software is for everyday business people.

MapBusinessOnline territory management tools assign the geographic extent of each territory to a map alignment layer such as ZIP codes, Counties, States, or City Limits. The significant advantage of tying territory geographies to administrative districts like ZIP codes is that location data associated with the territory areas is easily included as an analysis layer.

A nationwide territory map based on the ZIP code alignment layer created using MapBusinessOnline.

MapBusinessOnline territory maps are created by lassoing ZIP codes or counties or incrementally selecting the same geographies individually. User can also import territory spreadsheets for quick territory creation.

Combining Digital Maps with Easy-to-use Database Tools

By combining the power of accurate and informative map visualizations with a location database, the map user connects financial, demographic, health-related, and other societal trends with areas of the Earth’s surface. So, instead of creating territories to keep Fred the sales guy out of Frank the sales guy’s hair on the road, businesses can analyze market regions for patterns that point to growth potential, industry opportunities, and future threats to business. These tools can then help Fred and Frank, the sales guys, expand their sales horizons.

Franchise territory map visualization created using MapBusinessOnline.

A service territory coverage map created using MapBusinessOnline.

This also suggests that territories created using free-form drawn map features, without location database functionality, are not practical maps for business analysis. The data loses relevance without the structure of ZIP codes, Counties, or City Limits.

I put myself in the position of a business owner. Where would I invest my money if I managed or owned a retail chain, an insurance concern, a bank, or a factory? I would want to invest it in a business I was interested in, where the products or services displayed growth potential. Business mapping software and territory mapping inevitably point to the physical areas with the most growth potential.

Gather Your Relevant Location Data

Territory mapping software provides a digital framework for your business model and a database engine for overlaying location-based data on a business map. Data overlays available to your business maps include:

  • Your Business Data – historical sales, prospective customers, industry data.
  • US Census Bureau Demographic Data – including – household income, population, ethnicities, and consumer expenditures.
  • Business Listings with email addresses and firmographic data.
  • Relevant Business Information – Import industry resources, facility locations, and key distribution points.

A territory map overlaid with demographic data, business listings, & imported industry data.

Territory and market analysis results offer insights into business channels and frequently suggest a direction for market expansion. Business analysts and management teams apply MapBuisnessOnline driving time and distance queries, demographic analysis, regional map visualizations, and business data representations that enhance problem-solving and strategic planning:

  • Banks gain an understanding of the demographic character of areas of investment.
  • Manufacturing organizations can view nationwide business activity and make distribution plans and sales representation decisions.
  • Large insurance companies expose saturated markets and sales area coverage gaps.
  • Construction firms monitor projects and manage contracted labor based on deadlines, inspections, and weather.
  • Large and small retailers monitor marketing campaigns and consider optimum driving times for core audiences.
  • Medical & dental businesses use driving distance analysis and demography to define their prospective client base and plan for growth.

Territory Management One Pillar of Business Mapping Software

As a business manager for MapBusinessOnline, it is fantastic to recognize business commonalities across our customer base: Automotive part suppliers, billboard marketing firms, beer and soft drink bottlers, car rental agencies, dental practices, financial concerns, floor covering companies, furniture retailers, hospital systems, real estate firms, sales & marketing firms, transportation companies, to name just a few.

Territory management is one pillar of the MapBusinessOnline business mapping service. For many of these large and small businesses, territory management requirements drove them to MapBusinessOnline. Drive time analysis, database management tools, demographic data, business listings, beautiful map visualizations, and more features – why they come with the territory.

Posted in Business Mapping Software blog post, Franchise Mapping, How to instruction, Sales and marketing | Tagged , , , , , , , , | Leave a comment

MapBusinessOnline Improvements & Enhancements Over the Years

MapBusinessOnline.com has been providing business mapping services since 2010. The years slip by so fast in the fast-paced world of business mapping software. The MapBusinessOnline development team has been very busy adding features and capabilities during the product’s lifespan to date.

Released in 2010, MapBusinessOnline began life as a primary map visualization tool with the ability to import a location-based spreadsheet, create vehicle routes, search data based on drawn map features, and create a simple territory.

All of those initial capabilities have been significantly enhanced. New features, relevant business data, and map layers have been added. Below is a growing list of improvements to MapBusinessOnline.

Enhanced Business Map Visualizations – Compelling and informative maps are core to our product offering. MapBusinessOnline software developers are well-versed in Geographic Information Systems software development. So, it is no surprise to find large and small mapping enhancements that make your job as a map creator easier and the map views you present more meaningful. Enhancements include:

  • Higher-resolution maps and printouts through vector tile support.
  • Large format PDF file export with legend control.
  • 4K print support.
  • Enhanced map looks & feel controls – line color & thickness, transparency, & back to front data adjustments.

Map visualizations combine demographic themes, imported location data, spatial searches, and relevant labels. Background maps and overlaid color options lend compelling brushstrokes.

Territory Management Tools for Franchise, Sales, & Service Orgs – Ninety-five percent of the large corporations who subscribe to our map services use MapBusinssOnline to create and manage territories. Territory management means creating eye-pleasing, definitive, balanced territories that address overlap. MapBusinessOnline presents your business’s territory geographically and in a tabular datasheet view. Improvements are many:

A nationwide territory map based on ZIP codes is a typical corporate application.

Logistics Planning – Among MapBusinessOnline Logistics customers are freight companies, manufacturing entities, and online retailers. We provide a convenient and affordable solution for trucking and logistics departments to create map-based portfolios of their key clients. Traveling salespeople use optimized routing to plan sales trips and explore new markets. You’ll find new capabilities:

A logistics map displaying distribution centers.

Sales Prospecting – You’d be surprised how many users use MapBusinessOnline as a basic CRM system. Customer address spreadsheets are easily imported into the application to create informative customer maps.  From there, segmented marketing lists can be created; vehicle routes can be generated for routine sales calls or sales prospecting.

A customer map for planning purposes created using MapBusinessOnline.

Market Analysis may be the most powerful aspect of MapBusinessOnline. We’ve added advanced features that leverage first-in-class map visualizations with demographic data analysis and driving time and distance queries. The process is simple – geographically define your most successful existing markets and identify untapped areas with similar characteristics. Explore the advanced market analysis features of MapBusinessOnline:

Market analysis maps address issues like expansion plans, competitor maps, or site selection.

Search for and Plot Business Listings – MapBusinessOnline introduced business listings in 2019. Business listings provide plotted map points and key firmographics that help estimate prospect potential for salespeople or display the proximity of clients, resources, and competitors. We continued to improve business listing tools in 2023:

Market maps applying imported leads from MapBusinessOnline business listings.

Batch Analysis Tools are a key component of MapBusinessOnline Pro, our advanced yet affordable driving time and distance analysis tool. Query all points in one or two datasets with thousands of locations. Results may be used to analyze transportation efficiencies or to determine supply chain adjustments. Pro can be used to conduct proximity searches, allocate customers to distribution points, or consider new facility placements. It’s the tool to use if you need to query multiple locations in one pass.

Drive time service areas

Map Data – MapBusinessOnline’s success is partly due to our carefully selected and curated associated data. Demographic data and business listings combined with the various map layer options add critical business elements to any map-based market analysis.

Demographic data was mapped and color-coded to display female-headed households with no Husbands.

Above and beyond major feature enhancements, MapBusinessOnline undergoes constant map engine tuning to optimize accuracy, speed, and resolution through applied technology improvements and best online practices.

MapBusinessOnline is an affordable business mapping software for the future. This online business mapping software has a legacy of enhancements and improvements and a reputation for adapting the most appropriate new technologies at the best possible time.

Request a Web Demo here.

Posted in Business Mapping Software blog post, Franchise Mapping, How to instruction, Sales and marketing | Tagged , , , , , , , , , | Leave a comment

MapBusinessOnline Pro – Combines Driving Time Queries with Demographic Analysis for the Win

When you are in sales, the old duffers love to ask you, ‘What’s your elevator speech?’ What they mean is, if you suddenly found yourself in an elevator with the president of your biggest prospective account, how would you sell him on your product so that he takes the next step towards buying before exiting the elevator?

Assuming you have a few floors, how would you explain your most appropriate product to a briefly captive audience?

While MapBusinessOnline Pro has an array of advanced business mapping software features, what I believe sets it apart from our direct competitors and from the much more expensive GIS options is the combination of demographic mapping and driving time and distance analysis it offers for less than $1,000. You just won’t find this location and demographic analysis combination anywhere else at this price point.

Ding. The elevator door opens, and the prospect walks off the elevator. Ah, but he stops, hands you a card, and says, ‘Ask my administrative assistant to put you in touch with Hannigan. He’s in charge of software.’

For all of you young and old duffers out there, MapBusinessOnline Pro is becoming a very popular upgrade from MapBusinessOnline Standard. Prospects who purchase Standard and clients who’ve been using Standard for years eventually realize that Pro, for a few hundred dollars more, opens up a world of demographic and drive time analysis that has never before been available for their use.

MapBusinessOnline Pro combines the power of:

  • Multi-point spatial analysis – polygon, radii, or ZIP code searches.
  • Specific driving time and distance queries.
  • Full-featured demographic analysis.

Think about it. You’re tasked with opening a new retail store or even a chain of retail stores. How do you affordably understand what or where the optimum area demographics are for your new site locations? You can hire a consultant and pay them a lot of money, or you can invest in MapBusinessOnline Pro, get free technical support, and determine the best five or six locations for your new stores.

Heat map analysis applied to a New England rectangle of hardware retailers reveals eight target cities.

MapBusinessOnline Pro provides these significant capabilities:

  • Import up to 250,000 location records per Map – Easily import data by latitude, longitude coordinate, or address. Color-code or heat map the points for professional grade map display.
  • Find all relevant data within the proximity of another set of points.

  • Create up to 1,500 territories per map – Whether you run a sales, service, or franchise business, MapBusinessOnline is the most advanced and easiest territory mapping tool on the market today. Think MapPoint 2025 and beyond!
  • Batch-generate point-to-point driving time and distance analysis – Estimate driving requirements, travel costs, or workforce requirements across your transportation network.
  • Enhance your Location Data – Append an imported location-based Spreadsheet with relevant demographic and geographic data.
  • Create multiple drive time-based territories in one pass. Quickly design and share a new territory structure for sales or strategic planning. (See above-referenced video.)
  • Find the nearest resources, suppliers, or customers to critical stores or processing plants – Compare multiple location datasets with thousands or records in a few minutes.
  • Develop world-class market analysis based on driving time areas – Reveal the key demographic characteristics of your target markets.

MapBusinessOnline Pro clients in construction, finance, healthcare, insurance, manufacturing, retail, sales & marketing, and transportation logistics use the tool to:

  • Create multiple drive time or radius-based territories in one pass. Perfect for site assessment analysis.
  • Create, share, and edit hierarchical drive time territories displaying tiers of territories, regions, and divisions.
  • Develop success-based market analysis that suggests new ZIP codes or Counties to set up shop in based on your business’s key demographics.
  • Monitor construction site progress and conduct asset management across multiple locations.
  • Develop expansion plans for retail, warehousing, and medical businesses. Build informative map visualizations and exportable data-rich analysis.
  • Conduct various demographic market analyses by ZIP code, County, or city limit areas.
  • Develop nationwide franchise territories by ZIP code or County using demographic data for franchisee balancing.
  • Conduct fleet transportation cost assessments across one or two large location-based data sets.
  • Enhance imported marketing, sales, or planning datasets with demographic data.
  • Access to all MapBusinessOnline features, including all levels of territory management, business listings, and optimized routing.

So the next time you’re in the elevator with the boss, and they start talking about your organization’s market analysis, think about how MapBusinessOnline Pro’s driving time and demographic data analysis might enhance your position. #Promotion #NewCar #SwiftyBoxSeats

Request a web demo.

Posted in Business Mapping Software blog post, Franchise Mapping, Sales and marketing | Tagged , , , , , | Leave a comment

How to Sum Demographic Values Using Calculated Data Columns in MapBusinessOnline

MapBusinessOnline provides subscribers with access to demographic data. By the way, the most recent Census Demographics have been updated in MapBusinessOnline as of Nov 2023.  The recent 2020 Census decennial counts are identified in the list as ‘Census 2020.’

We’ve discussed in previous blogs how to quickly query a circle figure on a business map, a ZIP code, or a County for demographic data. We also explored setting up territories and adding demographic data using the Choose Columns button from the Data Window.

Another helpful tool MapBusinessOnline provides is the Calculated Data Column (CDC) function.  Calculated Data Columns enable the creation of data formulas. The tool is located in Map and Data.

Within Map and Data, each map layer (ZIP Code, County, or State) has its own Calculated Data Column function. Hover your mouse cursor over the target map layer in Map and Data and select the Edit Map Properties Gear. In the corresponding dialogue, you’ll see the box at the bottom that says Manage Calculated Data Columns.

  1. Click Manage Calculated Data Columns.
  2. Click Add Data Column.
  3. Name the column.
    1. You can select the format for the calculation results – Percent, Number, Currency, etc.
    2. Manage numeric places and decimal places as required.
    3. It’s easy to go back and edit these selections later.
    4. When finished, click Formula Options.
  4. Select Simple Formula. Scripting is an option, too, but if you want scripting, you probably don’t require my assistance.
  5. In the Simple Formula panel, you’ll understand the power of CDC. Here, you can select demographic columns of data (or imported data columns) and move them to the right panel to build a formula.
    1. You can add columns together. For example, you can add multiple age segments to get a population subtotal that includes multiple demographic categories or columns.
    2. You could also create a ratio. For example, you could divide a gender population total by a total population to explore percentages.
    3. You can multiply the top section by the lower section. For example, you could multiply a currency column by a quantity column.
    4. With your formula factors applied, click Add in the lower right and exit the formula builder.
  6. To apply your Calculated Data Column for map visualizations or analysis, look for the data as an option within data dropdowns. CDC data is available when Color-coding by your target map layer, importing data into your territory analysis, or summarizing data. Remember, the formula is assigned to either a ZIP code, county, state, or city limits layer. This means if you set up a CDC in the ZIP code map layer, it will NOT be available for county and state-based operations.

A popular use case of Calculated Data Columns is collating similar Census category columns into a summed category total, which can then be applied across the entire map layer. Thus, for the map layer ZIP 5 codes, we could sum all ages of the population between 30 and 49 years. This CDC formula is then available for ZIP 5 code calculations using the Summary function, territory analysis for any area of ZIP 5 codes, and color coding ZIP 5 maps when using that saved map.

A Business Mapping Software Example of Calculated Data Columns

Let’s color code all USA ZIP codes to reflect the size of the population aged 65 and up.

  1. Create a new map using the USA template.
  2. In Map and Data, Edit the Zip 5 map layer.
    1. Select the Calculated Data Columns option.
    2. Name the Layer USA ‘Old Duffers.’

      Creating a Calculated Data Columns formula named Old Duffers.

  3. Create the Formula. Move the selection of age ranges from the left side of the Demographic data into the top formula box on the right. Click Add.

    Selecting data layers for summing.

  4. Exit out of Map and Data and Select the Boundary color-code option along the master toolbar.
    1. Select the ZIP 5 map code layer.
    2. Select the USA Old Duffer layer in the data options dropdown.
    3. Choose the map visualization options for optimum map display:
      1. I limited my color-coding to four variables.
      2. Adjust your color-coding tiers to reflect reasonable numeric shift points. I did this several times before settling on a scheme I liked. This will be reflected in the Map Legend. You can edit the Map Legend too.
  5. Select a color scheme and click Preview or Done.
  6. Repeat the procedure of color-coding to adjust the scheme.

My final Older Americans Map:

Population of Older Americans by ZIP Code.

After a few more color adjustments, a few labels, and zooming into California,

And that is how you use Calculated Data Columns in MapBusinessOnline.com.

Request a web demo.

Posted in Business Mapping Software blog post, Franchise Mapping, How to instruction, Sales and marketing | Tagged , , , , , , , , | Leave a comment

How to Create a Nationwide ZIP Code Territory Map

A nationwide ZIP code-based territory map, created using MapBusinessOnline.

Does the above map call out to you? Is this territory scheme similar to the map you want to create for your business? If so, read on to learn how to create a nationwide territory map.

MapBusinessOnline is specifically designed to enable the creation of beautiful and informative business maps by everyday business people like you and me. There is no need to hire a cartographer or a GIS specialist when you’ve invested a few dollars into MapBusinessOnline.  Territory map capabilities within MapBusinessOnline can be applied to sales organizations, franchise businesses, and service organizations.

First, Adjust the ZIP Code Data Source

To create the best-looking territory maps, adjust the ZIP code settings in MapBusinessOnline for territory creation. Use the ZIP code with the Fillers option set in Map and Data.

  1. Open Map & Data (the gray map layer check box hovering over your map.)
  2. Select Map Options and then the ZIP code Tab.
  3. In the Check box at the bottom of the panel, drop down to and select ZIP codes with fillers.

This setting automatically deals with the non-ZIP code areas that pepper the United States, including national parks, extremely rural sections out west, and military installations. ZIP codes with Fillers merge those unassigned areas with the abutting ZIP codes, making your map view solid and consistent. Remember that you can’t fix these unassigned areas of your map later; you must select this setting before starting your territory map. Once selected, you’re all set – forever.

Determine Your Base Map Alignment Layer

As you can see, the state-level territories created in the above map, in many cases, combine multiple states. MapBusinessOnline has rules for territory creation across jurisdictions that keep things organized:

  • Combined and split state territories must be created from lesser map alignment layers – i.e., ZIP codes or Counties.
  • While not recommended, overlapped territories can be created and configured to stand out visually using Territory Options in Map and Data. Learn more about Territory overlap.

ZIP codes are the most common map alignment layer used to create territories. ZIP codes provide the most flexibility in territory creation for a USA-wide map where territories are roughly outlined by state(s). A territory creator must choose which map alignment layer makes the most sense for their particular territory map requirement:

  • Most franchise organizations use ZIP codes for their territory map alignment layer because they offer easily compiled segmentation with accurate and up-to-date demographic data.
  • Rural service orgs lean toward counties for their map alignment layer.
  • Large and national organizations sometimes choose states as their map alignment layer unless they have hierarchical tiers that tend to favor ZIP codes or Counties.

National Territory Creation

MapBusinessOnline provides several ways to create a nationwide territory map. If you have all your ZIP codes neatly assigned to a territory in one spreadsheet, you can import the territory spreadsheet and quickly set up ZIP code-based territories.

An example of a ZIP code-based territory import spreadsheet.

MapBusinessOnline’s territory import process now supports hierarchical territory imports as well.

Suppose a territory creator does not have a territory spreadsheet to import. In that case, the best way to create a nationwide territory is by gathering groups of ZIP codes using a Polygon Search Tool.

If your company only requires whole state-level territories – territories made up of one or more whole states – it’s easy to select individual states with your mouse cursor, hold the shift key down to select more, and then name the resulting territory. However, most territories are more complex and, as such, require the flexibility of a ZIP code bases map layer.

The ZIP code territory creation process:

In Map and Data, Check on the ZIP code layer and adjust for transparency.

Adjust the ZIP code map layer for transparency.

  • Turn on the State Layer for reference, and uncheck the state color Fill, which prevents ZIP code selection. Darken up state boundaries in Map and Data for clearer guidance as you select groups of ZIP codes.

Optimize the state layer – darken boundaries and uncheck fill.

  • Under Search Tools on the Master Toolbar, select the Polygon option. Place your cursor on the map where a selection of target ZIP codes exists and run the polygon inside the targeted ZIPs’ borders, connecting the polygon back to the starting point. A dialogue box opens – select the ZIP code layer.

Select a group of ZIP codes using the polygon tool.

  • Click Next and name the Territory. There is a notes box in the naming dialogue for reference information. Try creating and deleting a few territories to get the hang of it.

Name the created territory. You can always rename the territory later.

  • The territory Data Window view appears. This tabular data view is designed to manage data associated with your territory. Remove redundant data using the Choose Columns button in the lower right. You can add demographic, imported sales, or business listing data in the Data Window territory view. All additional territories created will include the same imported tabular data layers in the data window view.

Adjust the Data Window view by adding imported data and or demographic data.

  • Delete the ZIP code gathering Polygon by clicking Delete in the associated dialogue box.
  • Repeat the territory creation process until the entire USA or regional coverage area is completed and all territories are named.

An unoptimized rough draft nationwide territory map.

The above territory picture is a rough draft of my final map. It still needs some fine-tuning. The territories are all in place, but you must adjust border areas that may have missed small ZIP codes, especially along river borders. This is just a tedious fact of territory creation. Many tiny ZIP codes require editing, especially in the east of the USA, where rivers are boundaries.

Territory edits out west are easy:

  1. Zoom into the area or territory.
  2. Select an unselected ZIP code with your cursor and hold down the Shift Key.
  3. Select all the other ZIP codes requiring inclusion.
  4. Click the Edit Territory option in the open dialogue.
  5. Select the Add to Territory Option and select the target Territory.
  6. Click the Edit option in the lower right.

The Edit Territory dialogue. Choose the manner of Edit required on the right and select the target territory.

Let’s look closer at a map section:

Area requiring territory edits.

The snippet of the territory map to the left shows several potential edits.

The two light green ZIP codes with the red border are unassigned. They were missed in the territory creation process. Select them (select one, hold down the shift key, and select the other) and Add them to the green territory.

Notice the darkened ZIP code at the border of three states. That indicates overlap. It also shows that ZIP codes do not always align with state boundaries. In this case, I recommend removing the ZIP from the territory to the west and leaving the ZIP in the territory to the east because most of the ZIP area exists there. Once the ZIP is selected, options display for selecting either a territory or the ZIP code. Choose the ZIP and use the option to Remove from All Territories Except.


The Edit Territory dialogue provides various ways to edit misapplied ZIP codes:

  • Add to territory – Select and Add to.
  • Move to territory – Switch a ZIP code or selection of ZIPs from one territory to another. Choose the territory to move to, and the application will remove ZIP from the previous territory and place it in the target territory.
  • Update territory – Select a group of ZIp codes and update the entire territory with that selection.
  • Remove from territory – You guessed it – select and remove those ZIP codes.
  • Remove from all except – This is handy when you incorrectly assigned a selection of ZIPs to one or more territories but want to preserve the selection you added to the correct territory.

Fine Tune Your Map’s Look and Feel

Once your ZIP code territories are reviewed, you can fine-tune your map’s look and feel. These adjustments are suggestions. Use your judgment. Make adjustments, and then take a look. Think about how your map audience will react.

  • From the nationwide view – consider the labels. Do they make sense? Will they invite criticism? Are they woke enough? (OK – that’s a joke! Lighten up!) Adjust as necessary.
  • Consider adjusting colors – Avoid colors that are too bright or too dark. Keep similar color shades separated.
  • In Map and Data > General, check Hide Internal Boundaries.
  • Turn off the ZIP code layer. Decide if that looks better.

On my map, I made the following adjustments:

  • Renamed the territories to develop a consistent, readable naming system.
  • Darkened the territory boundaries.
  • Removed the ZIP code layer and checked the Hide Internal Boundaries box.
  • Adjusted territory colors to be more pastel and less offbeat.
  • Adjusted the territory label positions.
  • Removed the state layer auto label and transparentized territories. The state label bleeds through from the Street data layer.
  • Simplified the legend and placed it in the pocket of the Atlantic coast, where a rectangular image would include the legend.

The contiguous USA territory map view.

My nationwide map contiguous view.

Lastly, a conterminous view, with Alaska included:

USA territory map with Alaska.

Conterminous view, including Alaska and or Hawaii, is an option in the image file export button.

Conterminous with Alaska & Hawaii.

Feel free to request a territory creation web demo.

Posted in Business Mapping Software blog post, Franchise Mapping, How to instruction, Press Release, Sales and marketing | Tagged , , , , , , | Leave a comment

Share Territory Maps with Field Staff Through KML Export

Over the summer, MapBusinessOnline image file export options were enhanced to include KML support. In addition to exporting images such as PNG, Jpeg, or PDF files, MapBusinessOnline now supports KML files.

Keyhole Markup Language (KML) is an XML-based file format that enables the transfer of geographic features to third-party software such as ArcGIS Earth, Google My Maps, and Google Earth. KML allows the MapBusinessOnline user to draw points, lines, and polygons on business maps and share those drawing overlays with other mapping users outside the MapBusinessOnline universe.

Put another way, map drawings and territories created in MapBusinessOnline, exported in KML format, can be imported and overlayed in third-party mapping software that supports KML use in the field. Additionally, traveling field staff can access shared territory maps as KML files and quickly import them into mobile devices for display over Google MyMaps or other mobile map apps.

Currently, standard maps created in MapBusinessOnline are not supported on a mobile phone application. However, a map creator using MapBusinessOnline can create multi-colored territories or drawings showing highlighted and color-shaded areas and export those drawn figures as a KML file. Those KML files can then be imported into third-party desktop and web-based applications and apps supporting maps on a cell phone.

KML Support for Territory Map Views

How could KML Map image export come in handy?

MapBusinessOnline generated territory scheme imported as a KML file into a Google Earth map project.

Companies that create sales, franchise, or service territories using MapBusinessOnline have multiple reasons for viewing territory maps on third-party web or mobile mapping applications, including:

  • Sharing territory map views and areas of responsibility with field technicians, sales reps, or franchisee employees.
  • Executive or management map views supporting sales planning, strategic planning, and general management decision-making. Think CFO with a laptop on a plane.
  • General geographic referencing for customer service representatives to confirm customer locations and match customers with field tech territory assignments.
  • Field routing applications in construction and insurance can benefit from awareness of proximity to territories when approaching job sites.

These are just a few examples of KML territory applications we know. There are many more possible applications for business mapping KML support.

In any of the above scenarios, a territory manager can easily export a KML file out of MapBusinessOnline and import the file into a KML-supporting application. The exported territories would appear on the map view draped over the original map.

A franchise territory map in MapBusinessOnline above, exported to Google Earth below.

The process for moving KML files from MapBusinessOnline to other KML applications is outlined below:

  1. Export the territory or draw layers from MapBusinessOnline by clicking the Export Map Image button on the Master Toolbar.
  2. Select the KML Territories or Drawings option in the Map Image dropdown.
  3. Select KML or KMZ file format and export.
  4. Import the data via the standard drawings or image file import process within the target application (Google Earth, Google My Maps, ArcGIS Earth, or other applications). Applications usually specify KML import options.

The process for importing KML files into the Google Earth web application  is also simple:

  1. Log into Earth.Google.com.
  2. In the Google Earth Dashboard view, choose File in the upper left dropdown and select Import KML/KMZ file.
  3. Select your file and click Open.
  4. Google Earth zooms into your area of interest and displays your images or drawings.

For Google Earth mobile phone KML import:

  1. Drag the bar at the bottom of the app window up. KML import is on the right.
  2. Click the Plus sign (+), select Local KML, and then Import.
  3. Navigate to your local file and select it.

The Google Earth web-based dashboard, with the KML import button highlighted on the left.

Another Google web-based solution is Google My Maps, not to be confused with Google Maps.

  1. Go to Google.MyMaps.
  2. Select Create New Map.
  3. An Untitled dialogue opens in the upper left corner. Scroll down and click Import.
  4. Navigate to your KML data and select your target.
  5. My Maps does not zoom to the imported KML area; you will have to use the navigation zoom controls in the lower right of the app to zoom into your area of interest.

One nice feature in My Maps is that MapBusinessOnline territories appear in a map legend as clickable links. Clicking on the Territory name pops up a label and highlights the territory map’s alignment layer internal boundaries – ZIP codes in the case below.

A MapBusinessOnline territory KML file viewed in Google My Maps with internal boundaries selected.

Both Google Earth and My Maps offer a selection of background maps.

ArcGIS Earth & Mobile Phone KML Overlays

Another example of a business needing KML support is a busy organization with just one or two GIS professionals managing all map requirements using GIS tools. It’s common for such busy GIS pros to get overwhelmed with map requirements.

In such cases, an end user might require a territory map exported to an application like ArcGIS Earth on a cell phone for visual reference. MapBusinessOnline can provide the KML capability to make that possible. ArcGIS offers both desktop and mobile phone versions.

The exported KML file can be imported into cell phone mapping applications that support KML. That exported KML image is then geolocated onto the cell phone’s digital world map at the appropriate location. Thus, a map creator can generate cell phone map views with MapBusinessOnline’s advanced map visualization layers included.

To import a KML file into ArcGIS Earth:

  1. Launch the ArcGIS Earth application.
  2. Along the toolbar in the upper left of the application, click the Plus sign (+) and select the Add Files Option.
  3. Navigate to your target KML file, select it, and click Open.
  4. ArcGIS Earth zooms into your area of interest and displays your image or drawings.

ArcGIS Earth dashboard and the import pathway for loading a KML file.

The above pictures show MapBusinessOnline-generated KML images imported over ArcGIS Earth Mobile in an iOS phone view. A map user routing in the field can find themselves accurately located within the critical areas of interest. ArcGIS Earth Mobile or other apps unrelated to MapBusinessOnline might be used to collect data in the field.

ArcGIS Earth offers excellent background map options, including multiple topography views and recent USDA NAIP imagery.

KML Conclusion

If constituents ask for a few drawn map objects or territory layers to be shared with a user on a cell phone or in a specific map application, help them decide which KML-supporting map application best fits their need.

  • Google Earth for easy Import, auto-zoom, annotation options, and KML mobile phone map views.
  • Google My Maps for labeling. My Maps does support KML mobile phone map views.
  • ArcGIS Earth for the broad selection of background imagery. ArcGIS Earth Google Earth does support iOS phones with KML map views but not Android.

Then, send those field techs a KML file generated in MapBusinessOnline.

Request a quick web demo.

Posted in Business Mapping Software blog post, Franchise Mapping, How to instruction, Sales and marketing | Tagged , , , , , , , , , | Leave a comment